20060301
14-5-2
Drawing
f
(
x
) Type Function Graphs and Parametric Function Graphs
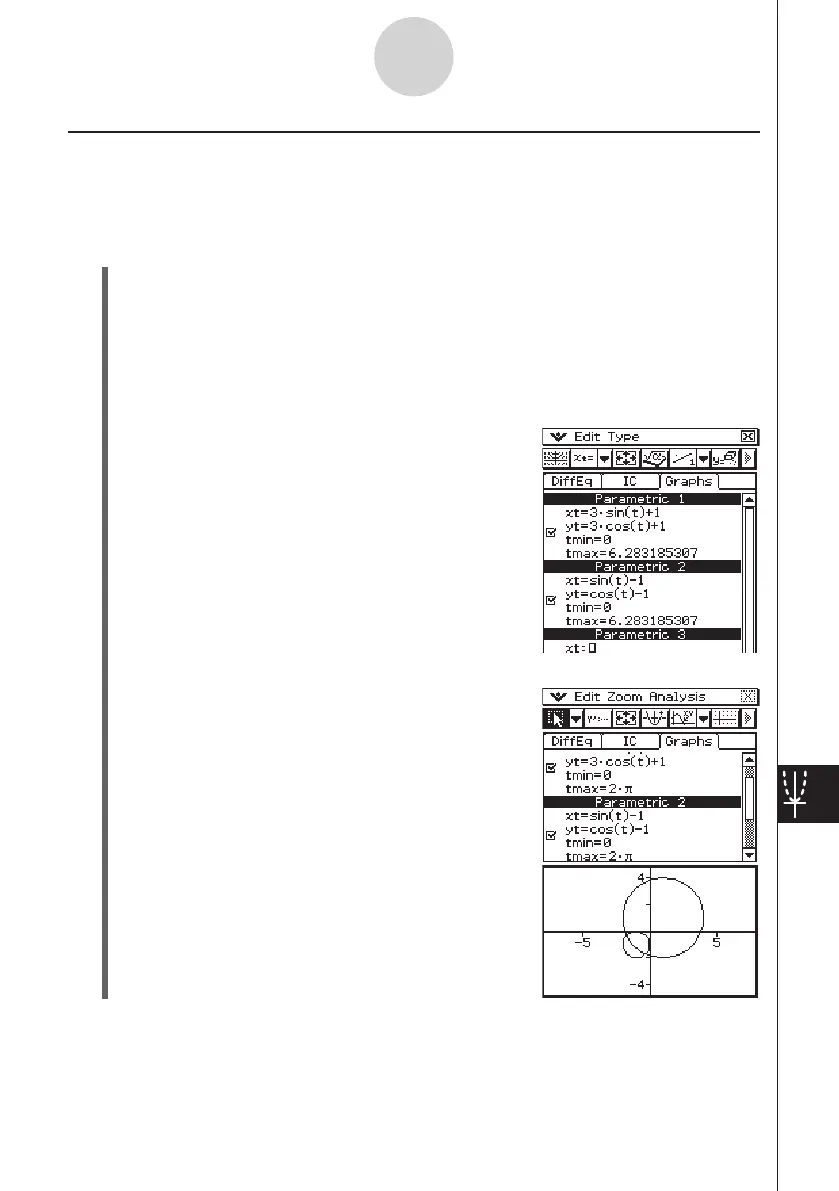
Drawing a Parametric Function Graph
Example: To graph {
xt
= 3sin(
t
) + 1,
yt
= 3cos(
t
) + 1} and {
xt
= sin(
t
) − 1,
yt
= cos(
t
) − 1}
(Angle Unit Setting: radian, 0
<
t
<
2
π
)
u
ClassPad Operation
(1) Tap the [Graphs] tab to display the general graph editor.
(2) Confirm that “Rad” is displayed as the angle unit setting on the left side of the status
bar. If it isn’t, tap the angle setting until “Rad” is displayed.
• For details about the information that appears in the status bar, see “Differential
Equation Graph Application Status Bar” on page 14-1-8.
(3) Tap [Type] - [Parametric] or the
g
toolbar button.
(4) Input the expression for each graph, and (0
<
t
<
2
π
) for the range of
t
.
9
d
T
s
(
[
)+b
w
d
c
(
[
)+b
w
a
w
c
7w
9
s
(
[
)-b
w
c
(
[
)-b
w
a
w
c
7w
(5) Tap
O
to draw the graph.
• To adjust the graph window, tap [Zoom] and then
[Quick Initialize].