20060301
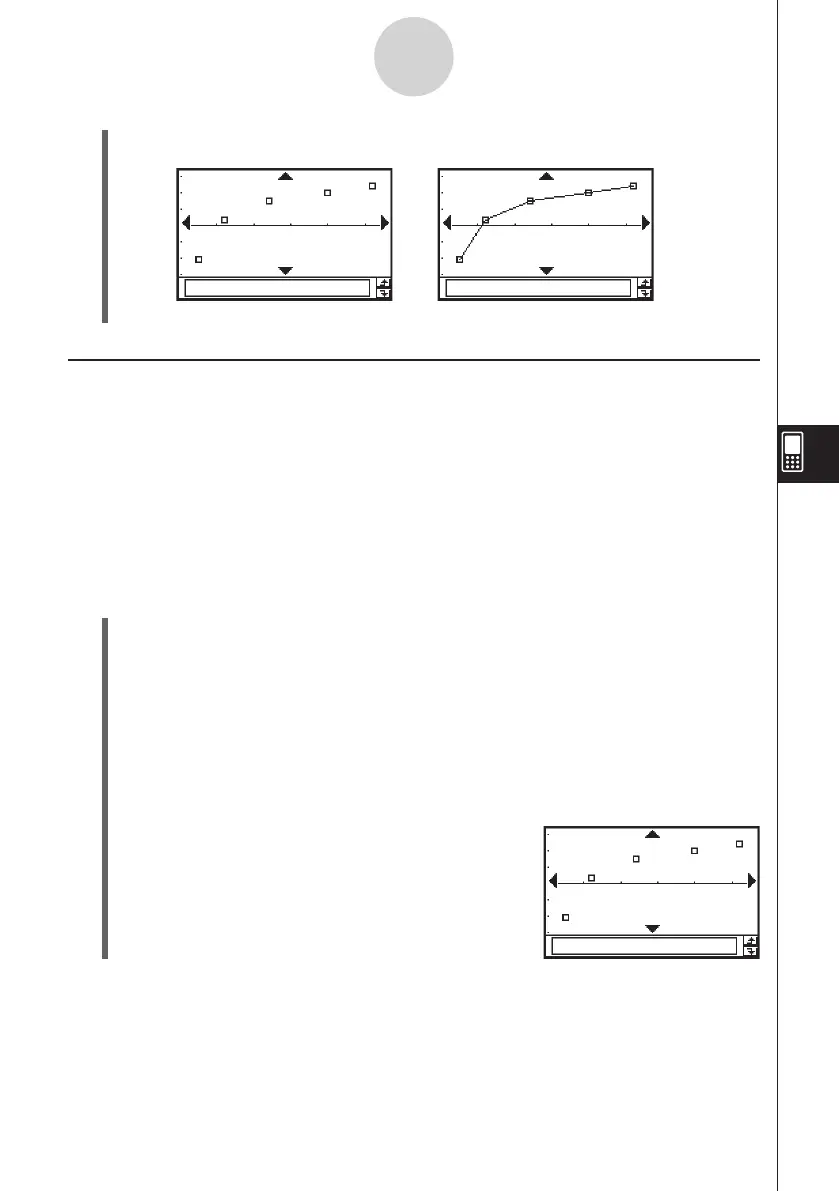
(9) Tap
y
to draw the
xy
line graph.
7-5-2
Graphing Paired-Variable Statistical Data
Drawing a Regression Graph
Use the procedures below to input paired-variable statistical data. Next perform regression
using the data and then graph the results. Note that you can draw a regression graph without
performing the regression calculation.
Example 1: Input the paired-variable data shown below and plot the data on a scatter
diagram. Next, perform logarithmic regression on the data to display the
regression parameters, and then draw the regression graph.
list1 = 0.5, 1.2, 2.4, 4.0, 5.2
list2 = –2.1, 0.3, 1.5, 2.0, 2.4
u
ClassPad Operation
(1)
m
I
(2) Input the data shown above.
(3) Tap [SetGraph] and then [Setting…], or tap
G
.
(4) On the Set StatGraphs dialog box that appears, configure a StatGraph setup with the
settings shown below, and then tap [Set].
Draw: On
Type: Scatter
XList: list1
YList: list2
(5) Tap
y
to plot the scatter diagram.
Scatter diagram
xy
line graph