20060301
7-4-3
Graphing Single-Variable Statistical Data
k
Graph Parameter Settings (page 7-3-3, 7-3-4)
• [XList] specifies the list that contains the data to be plotted.
• [Freq] specifies the frequency of the data.
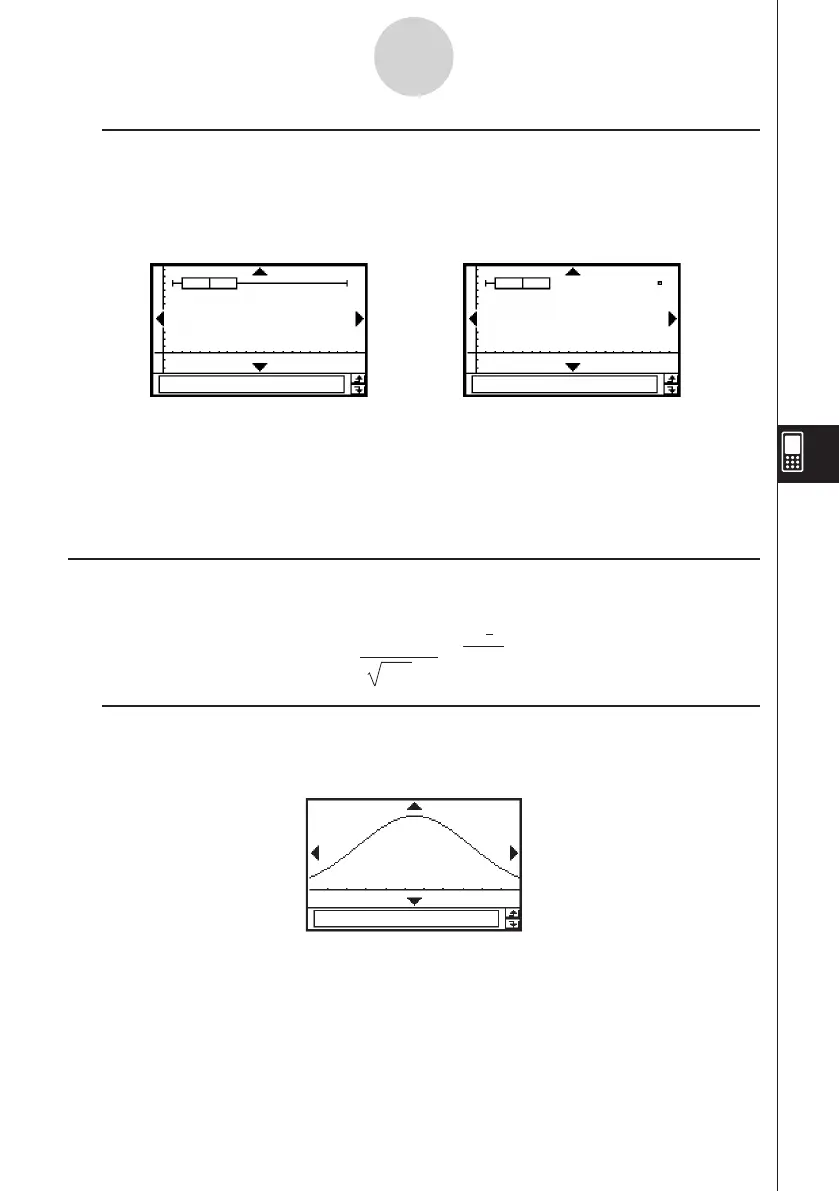
• If [Show Outliers] box is checked, “outlier” square symbols are shown instead of “whisker”
lines where a data value is relatively large or small compared to the other data values.
Tip
• When specifying a list of frequency values, make sure that the list contains positive integers only.
Non-integer values (such as those with a decimal part) cause an error during statistical
calculations.
Normal Distribution Curve (NDist)
The normal distribution curve is graphed using the following normal distribution function.
Figure. Do not show Outliers Figure. Show Outliers
k
Graph Parameter Settings (page 7-3-3, 7-3-4)
• [XList] specifies the list that contains the data to be graphed.
• [Freq] specifies the frequency of the data.