20060301
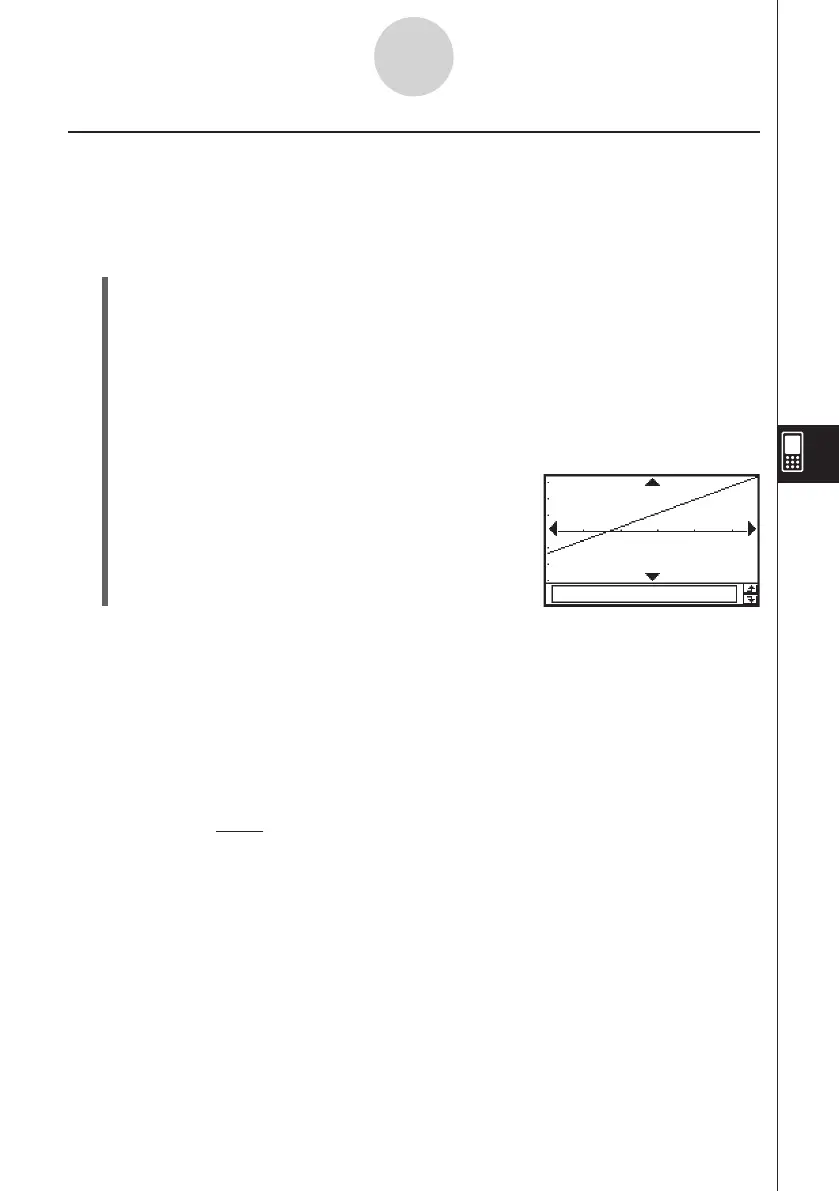
Drawing a Linear Regression Graph
Linear regression uses the method of least squares to determine the equation that best fits
your data points, and returns values for the slope and
y
-intercept. The graphic representation
of this relationship is a linear regression graph.
u
ClassPad Operation
Start the graphing operation from the Statistics application’s Graph window or List window.
From the Graph window
Tap [Calc] [Linear Reg] [OK] [OK]
"
.
From the List window
Tap [SetGraph] [Setting…], or
G
.
On the Set StatGraphs dialog box that appears, configure a StatGraph setup with the
setting shown below, and then tap [Set].
Type: LinearR
Tap
y
to draw the graph.
7-5-5
Graphing Paired-Variable Statistical Data
The following is the linear regression model formula.
y
=
a
·
x
+
b
a
: regression coefficient (slope)
b
: regression constant term (
y
-intercept)
r
: correlation coefficient
r
2
: coefficient of determination
MSe
: mean square error
• MSe =
Σ
1
n – 2
i=1
n
(yi – (a·xi+ b))
2