20060301
Overlaying a Function Graph on a Statistical Graph
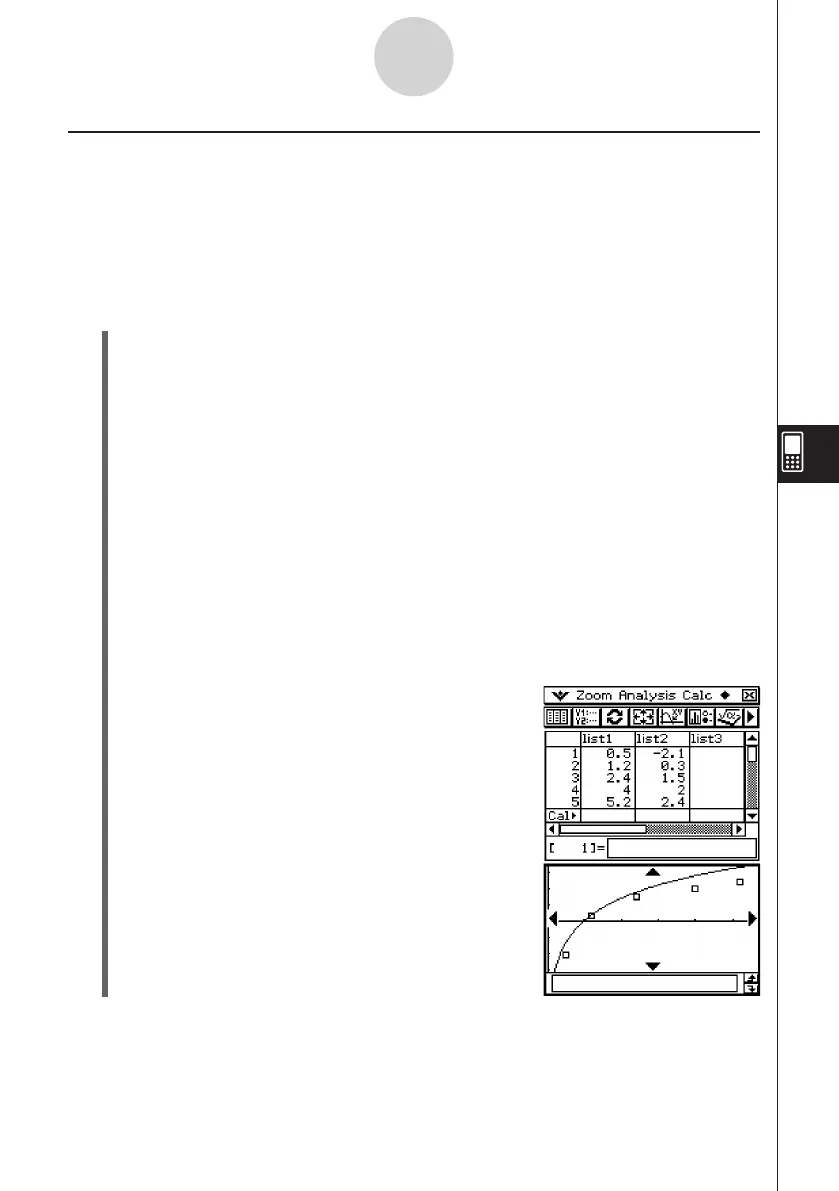
You can overlay an existing statistical graph with any type of function graph.
Example: Input the two sets of data shown below, and plot the data on a scatter plot. Next,
overlay the scatter plot with the graph of
y
= 2 · ln(
x
).
list1 = 0.5, 1.2, 2.4, 4.0, 5.2
list2 = –2.1, 0.3, 1.5, 2.0, 2.4
u
ClassPad Operation
(1)
m
I
(2) Input the data shown above.
(3) Tap [SetGraph][Setting...].
(4) On the Set StatGraphs dialog box that appears, configure a StatGraph setup with the
settings shown below, and then tap [Set].
Draw: On
Type: Scatter
XList: list1
YList: list2
(5) Tap
y
to draw the graph.
(6) Tap the List window to make it active, and then tap
!
.
(7) Input the following function into line
y
1: 2
×
ln(
x
).
(8) Tap
O
and then [Close] to close the Graph Editor window.
(9) Tap [SetGraph] on the menu bar. On the menu that appears, select the [Graph
Function] check box.
(10) Tap
y
to draw the graph.
7-5-15
Graphing Paired-Variable Statistical Data
Tip
• After drawing a function graph, you can perform trace and other functions.