20060301
Drawing a Logistic Regression Graph ( )
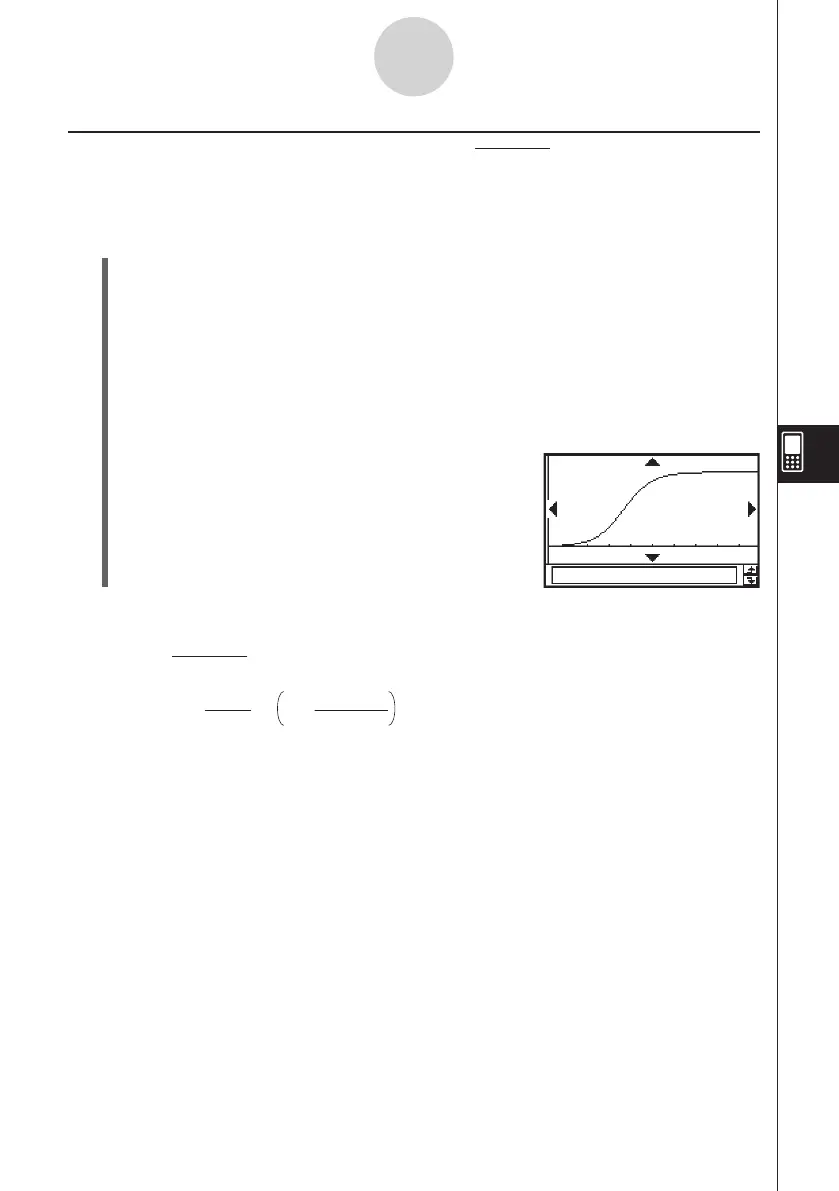
Logistic regression is best for data whose values continually increase over time, until a
saturation point is reached.
u
ClassPad Operation
Start the graphing operation from the Statistics application’s Graph window or List window.
From the Graph window
Tap [Calc] [Logistic Reg] [OK] [OK]
"
.
From the List window
Tap [SetGraph][Setting...], or
G
.
On the Set StatGraphs dialog box that appears, configure a StatGraph setup with the
setting shown below, and then tap [Set].
Type: LogisticR
Tap
y
to draw the graph.
7-5-14
Graphing Paired-Variable Statistical Data
The following is the logistic regression model formula.
Tip
• Certain types of data may cause calculation to take a long time. This is normal and does not
indicate malfunction.
• MSe =
Σ
1
n – 2 1 + a·e
–b
·
x
i
C
i=1
n
yi –
2