20060301
5-3-2
Drawing a 3D Graph
• The following are the allowable ranges for the indicated View Window parameters:
xgrid and ygrid: 2 to 50; angle
θ
: –180 <
θ
<
180; angle
φ
: 0 to 360.
• The angle parameters,
θ
and
φ
,
are always degrees, regardless of the current
[Angle] setting of the Basic Format dialog box (page 1-9-5).
(5) After all the parameters are the way you want, tap [OK].
• This closes the View Window dialog box.
k
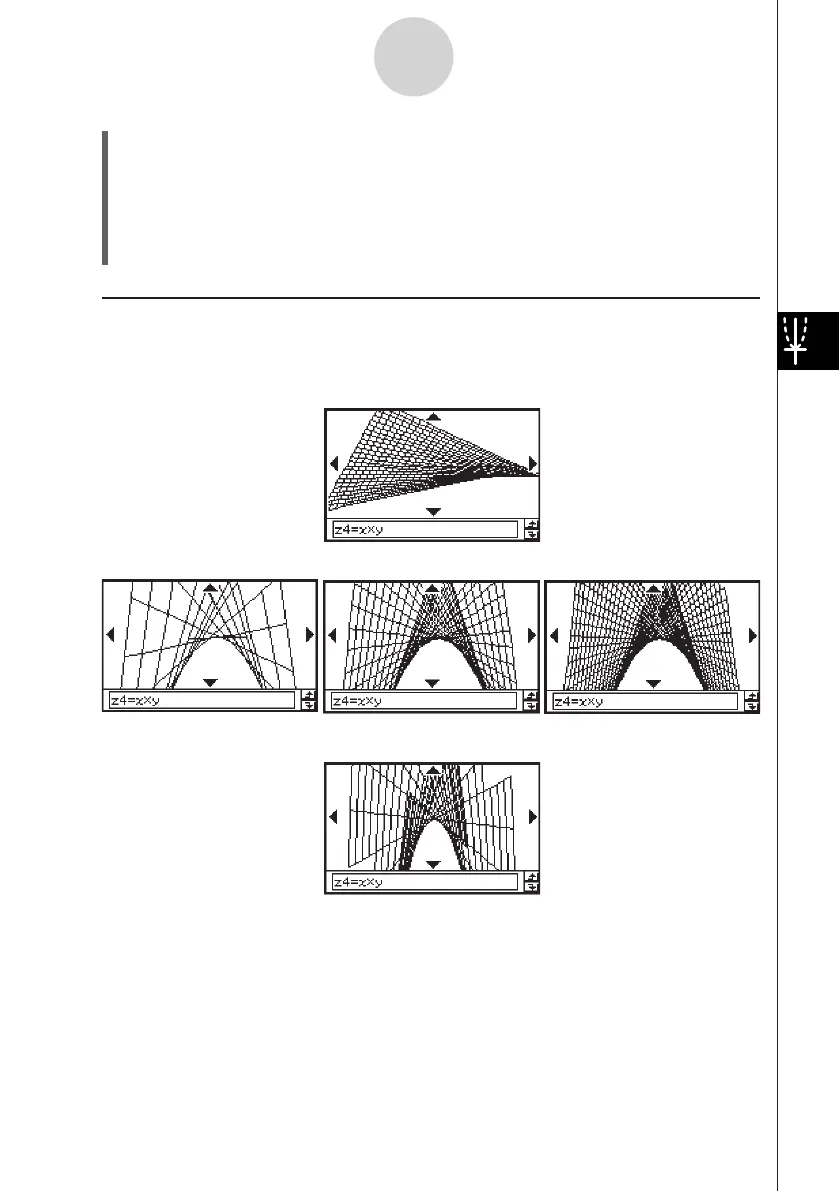
3D Graphs
The following are examples of the 3D graph
z
=
xy
using a number of different 3D View
Window setups. View Window parameters that are not specifi ed are set to the initial default
values.
Important!
• As is evident from the above sample screenshots, the greater the xgrid and ygrid
values, the more detailed the graph. Also note, however, that larger values require more
calculation, which means that the graphing operation takes more time.
• Graphing may be impossible if the xgrid and ygrid values are too small.
xmin/ymin = –1, xmax/ymax = 1
xgrid = 10, ygrid = 10 Initial defaults xgrid = 40, ygrid = 40
xmin/ymin = –5, xmax/ymax = 5
20080201