20060301
7-3-4
Before Trying to Draw a Statistical Graph
• The initial default frequency setting is 1. Specifying a list that causes each data value to be
plotted five times helps to improve the appearance of scatter plots.
• A list of frequency values can contain non-zero integers and decimal values. In the case of
a MedBox, or MedMed graph, however, a frequency list can contain positive integers only.
Non-integer values (such as those with a decimal part) cause an error during statistical
calculations.
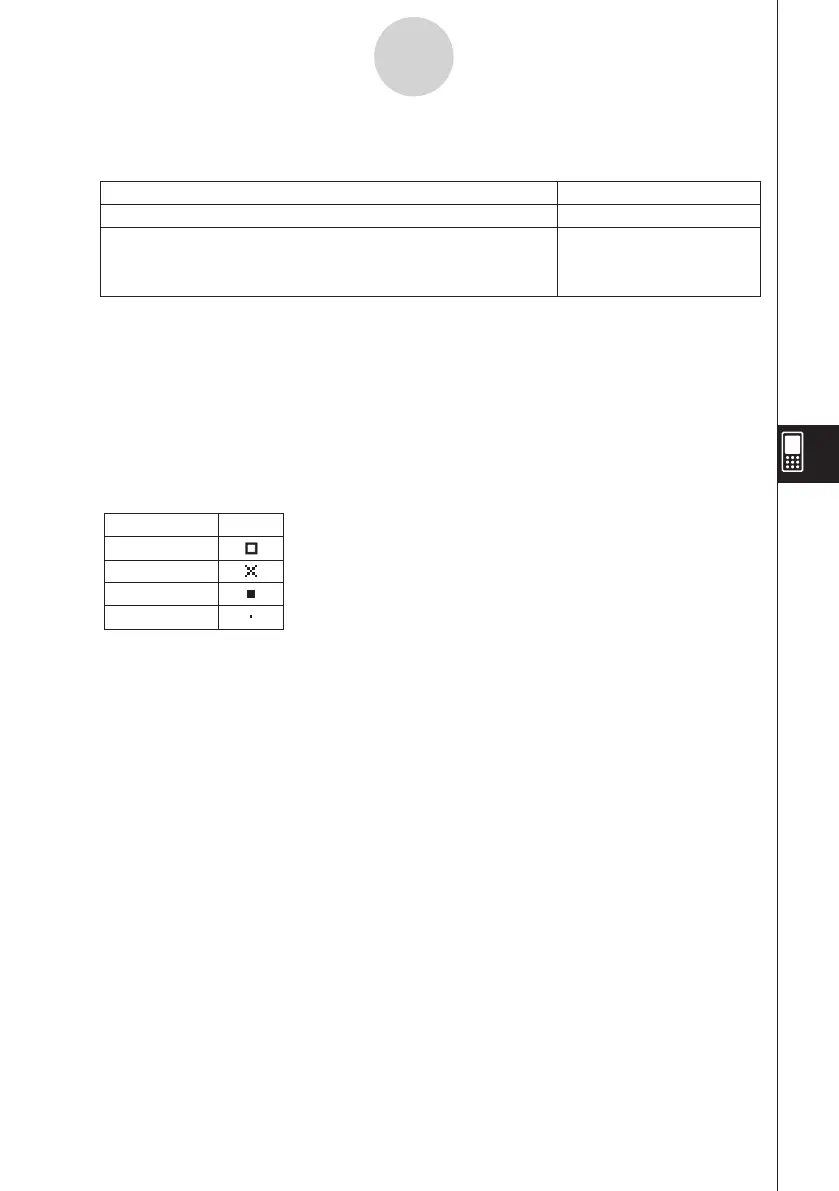
u
Mark
Tap the down arrow button, and select the shape you want to use for the plot points of a
scatter diagram (Scatter),
xy
line graph (
xy
Line), or normal probability plot (NPPlot).
Plot each data value once
1
Select this option:
To do this:
Specify a list whose values indicate the frequency of each
data value
list1 — list6
(or a list name you
assigned)
u
Freq
Tap the down arrow button, and then select the frequency setting from the list that appears.
square
cross
ldot
dot
Mark
Mark Name
Tip
• The default graph setting for all nine StatGraph setups is a scatter plot (Scatter).