EasyManuals Logo

Casio ClassPad 330 User Manual

Casio ClassPad 330
941 pages
To Next Page IconTo Next Page
To Previous Page IconTo Previous Page
Page #773 background imageLoading...
Page #773 background image
20060301
u
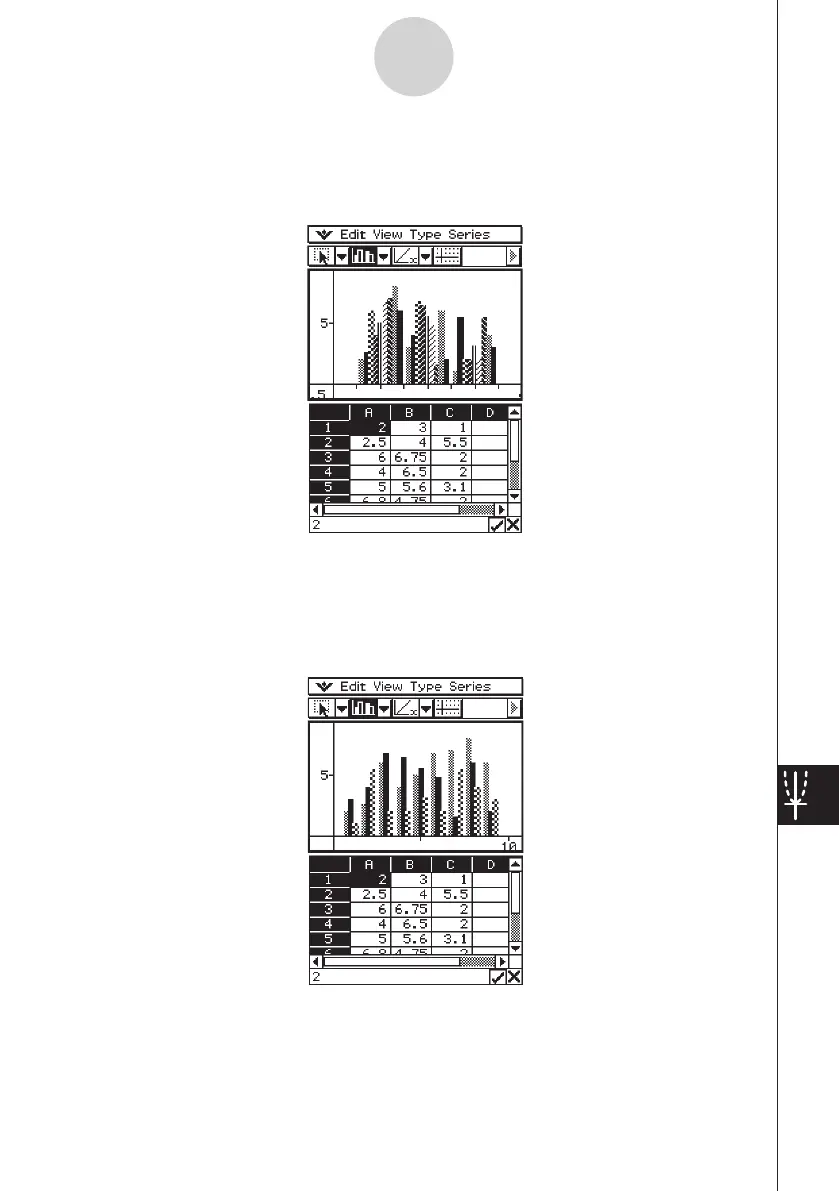
[Graph] - [Row Series]
Selecting this option treats each row as a set of data. The value in each column is plotted as
a vertical axis value. The following shows a graph of the same data as the above example,
except this time [Row Series] is selected.
u
[Graph] - [Column Series]
Selecting this option treats each column as a separate set of data. The value in each row is
plotted as a vertical axis value. The following shows a typical clustered column graph while
[Column Series] is selected, and the data that produced it.
13-8-10
Graphing

Table of Contents

Other manuals for Casio ClassPad 330

Questions and Answers:

Question and Answer IconNeed help?

Do you have a question about the Casio ClassPad 330 and is the answer not in the manual?

Casio ClassPad 330 Specifications

General IconGeneral
BrandCasio
ModelClassPad 330
CategoryCalculator
LanguageEnglish

Related product manuals