Viewing Style: Different styling options Color / Monochrome (B&W) with/without Symbols /
Bitmap etc. By selecting the option you can view on screen the different styles available to
you
Border Style: No Border, Thin Line, Shadow / Inset
Font Size: Large / Medium / Small
Display / Not display Legend
Numeric Precision: No up to 3 Decimals
Plotting Method: From Line / Bar / Point / Area / Spline / Combinations
Data Shadows: Off / Shadow / 3D
Grid Options: Various grid options ranging from dots / lines / different axis etc.
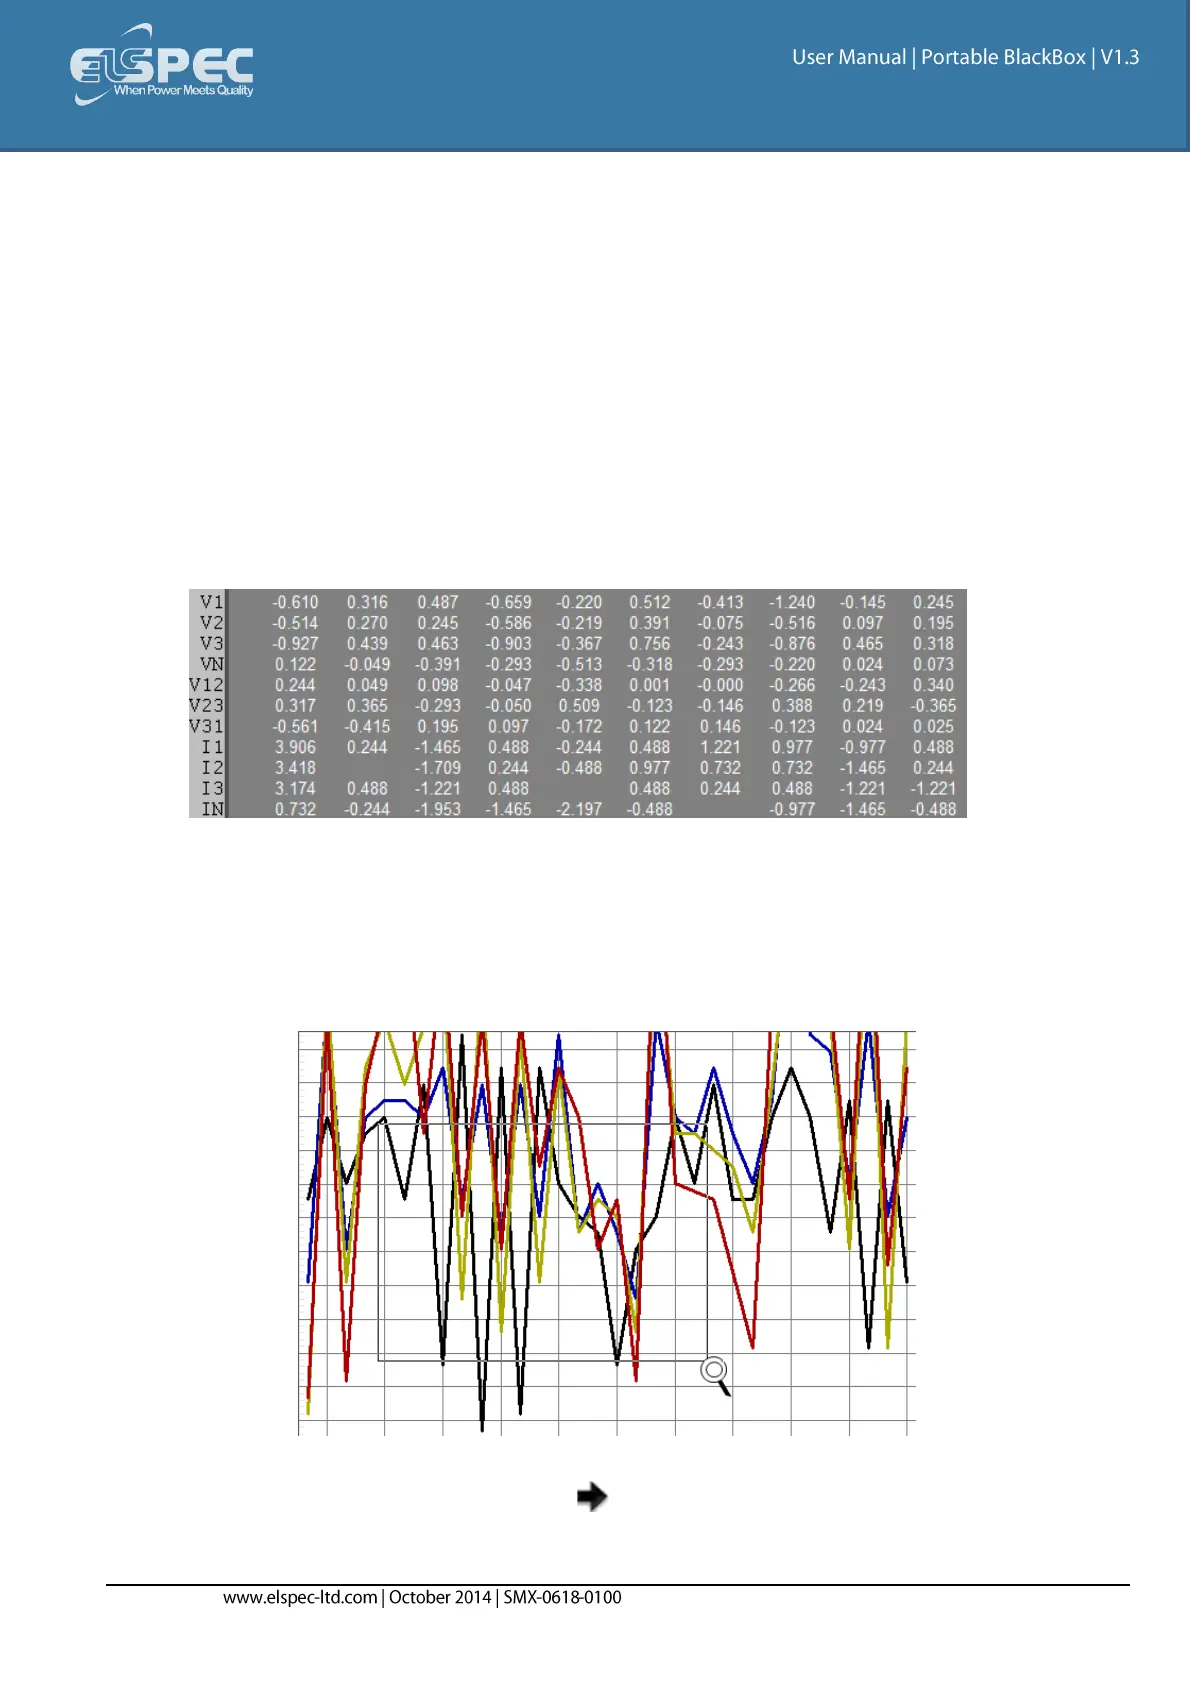
Graph & Table: Display either the graph / table / both:
Point Label Orientation: Auto / Vertical / Horizontal / Slanted
Mark Data Points: Displays data points on graph
Show Annotations: Displays annotations data descriptions
Zoom / Undo Zoom - Zoom in /out on your graph:
From the main Waveform window, select an area to zoom in. Left-click and
drag the mouse to define the area:
The enlarged area will now appear in the window
Zoom out by right/click & select Zoom out
Maximize: Maximize / Minimize graph