DSG-423 ENGINE CONTROLS
08-32
Plotting and Data Logging
Recording the values and voltages can be a very useful
tool while diagnosing engine problems. The FORD
diagnostic software includes real time plotting and real
time logging capabilities. These features enhance the
ability to diagnose and repair possible problems with the
FORD system. Both plotting and logging allows the user
to record, in real time, any variable that can be seen in
the FPP_Dis software. In order to record variables, the
FPP_Dis software must be “Connected” to the GCP.
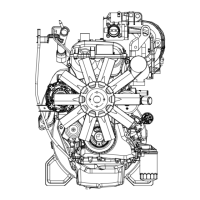
Plotting
To plot a variable, you must first “TAG” the variable. To
do this, use the mouse to right click on the variable. The
variable will highlight in green to let you know it is
“TAGGED”.
Next, press the “P” key or click the Plot/Log button and
then click the Plot Tags button to invoke the plotting
feature. This begins the plot function and you can
observe the plotted variables. The plot sweeps from
right to left. To stop the plotting feature, simply click the
“STOP” button. To restart the plotter, click on the
“START” button. The maximum number of variables
that can be plotted at one time is 10. The range of the
selected variables will be shown on the Y-axis and the
time will be shown on the x-axis. You may change the
desired time interval and sample interval for the plot by
stopping the plot and typing in a new intervals.
The plot can be saved to the PC by stopping the plot
and clicking the “SAVE” button. When saving a plot, you
will have to type in a filename. Plot files can later be
viewed with the edis_saplot software located in the
Windows Start Programs FPP_Dis folder, or the data
can be viewed in Notepad or Excel.
Here is a sample of a plot.
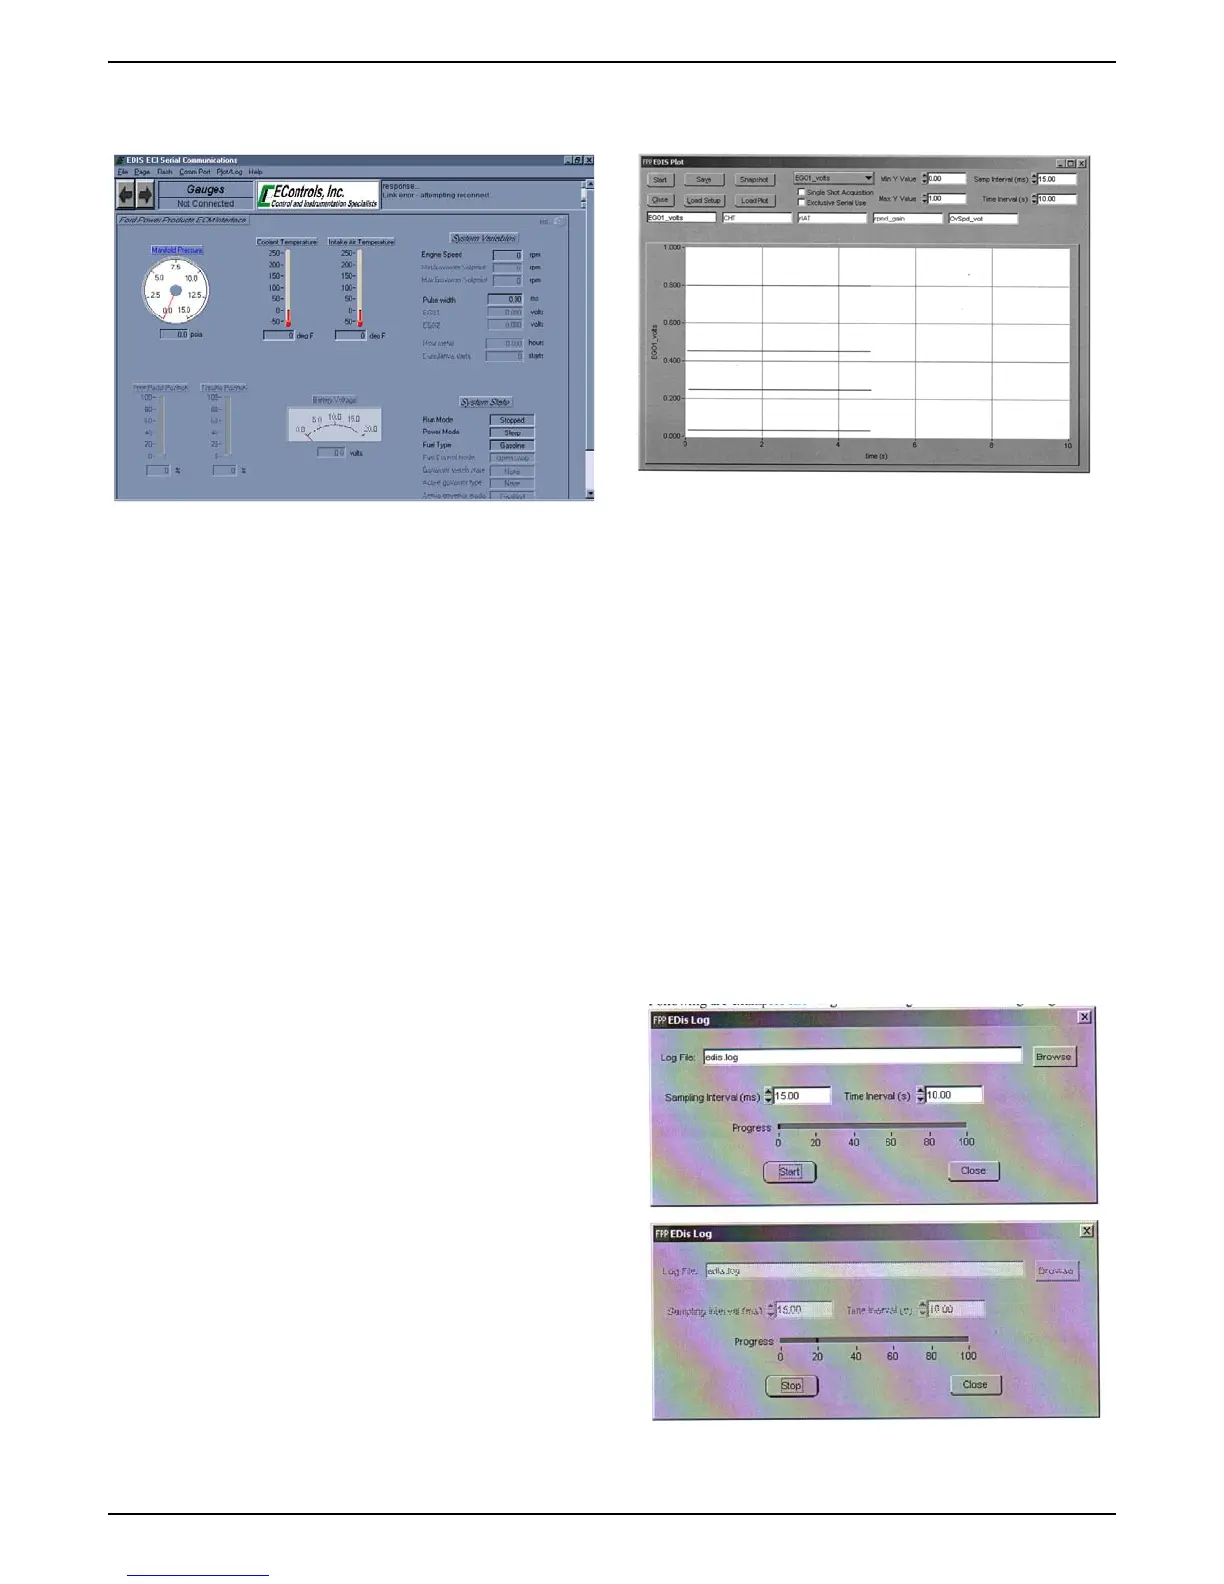
Logging
Logging variables means the variables are stored to the
PC. During logging, there is no plot shown on the
screen. To log variables you must first “TAG” the
variables by right clicking them (same as plotting). Next,
click on Plot / Log and then Log Tags. An “Edis Log”
window will pop up. You can type in a custom log File
name or select a custom folder to save the log file to.
The default filename is “edis.log” and the default folder
is FPP_Dis. The sample interval and time interval can
also be changed from the default. To start logging, click
on the “START” button. You will see the progress bar
moving from 0 to 100%. When the logging is complete,
you can close the Edis Log box or start another log file.
If you start another log file, you must change the Log
File name or the first log file will be overwritten. To view
the contents of a saved log file, you can use Notepad or
Excel.
The following are examples showing the Edis Log box
before starting a log file and during a log file.