Process Monitoring
11.2 Settings
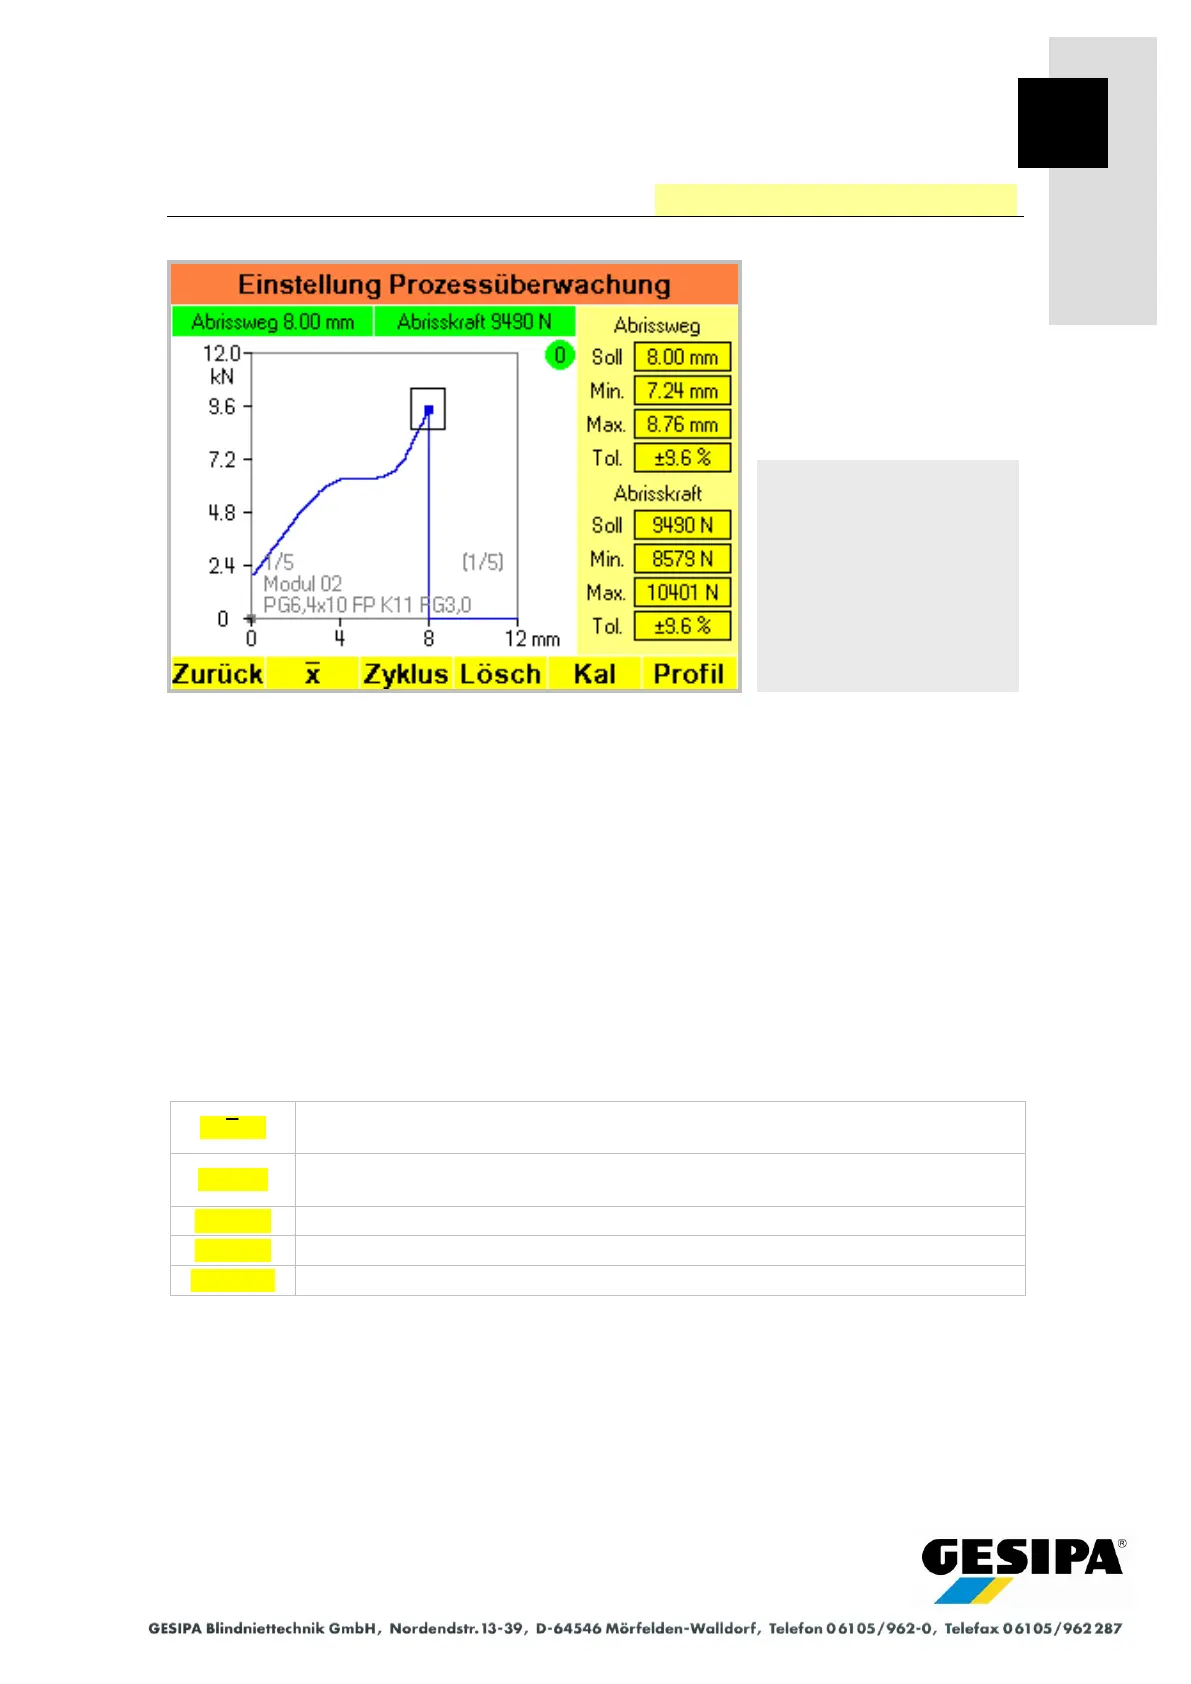
In the "process monitoring settings" menu:
- the current process curve is shown in detail, including the scaling of pulling displacement and
pulling force. The break-off point is highlighted in blue. The break-off displacement and break-
off force are shown above the process curve and highlighted in green or red depending on the
evaluation. When using one single profile the break-off points of the last 20 processes are ad-
ditionally shown as grey dots.
- the evaluation parameters are shown with the corresponding evaluation window of the blind
rivet last processed. The evaluation parameters and the scaling for the pulling displacement
can be changed. This means changes to the evaluation parameters are then valid only tempo-
rarily and should be saved in a profile. Information on the active profile is shown in grey in the
bottom area of the process curve.
The "process monitoring settings" menu is the starting point for all settings of the process moni-
toring system as well as for creating and managing profiles and profile lists.
Determines the evaluation window over the break-off points and automatically
adapts the evaluation parameters.
Executes one processing cycle
(see Section 8.7 "Manual Operation" "Cycle" function).
Deletes the current process curve and all break-off points.
"Process Monitoring Calibration" menu
Navigation:
AUTO
►MAN
► Menu
► Process monitoring
Process monitoring
settings