5 - 12
Transpector MPH Operating Manual
Dwell . . . . . . . . . . . . . . . . . . . . . The amount of time that Transpector MPH
averages data for each collected point.
Longer dwell times will decrease noise and
increase scan time while shorter dwell times
will be noisier and decrease scan time.
ppAMU . . . . . . . . . . . . . . . . . . . This is the number of points that
Transpector MPH collects for each AMU.
1 ppAMU will generate a bar chart with a data
point at each integer AMU value. >1 ppAMU
will generate an analog scan showing peak
shapes.
Linear/Logarithmic . . . . . . . . . . Displays the data either in a linear or
logarithmic scale. Since Transpector MPH
has such a large Dynamic Range, log scale
is often helpful for seeing low level
contaminants.
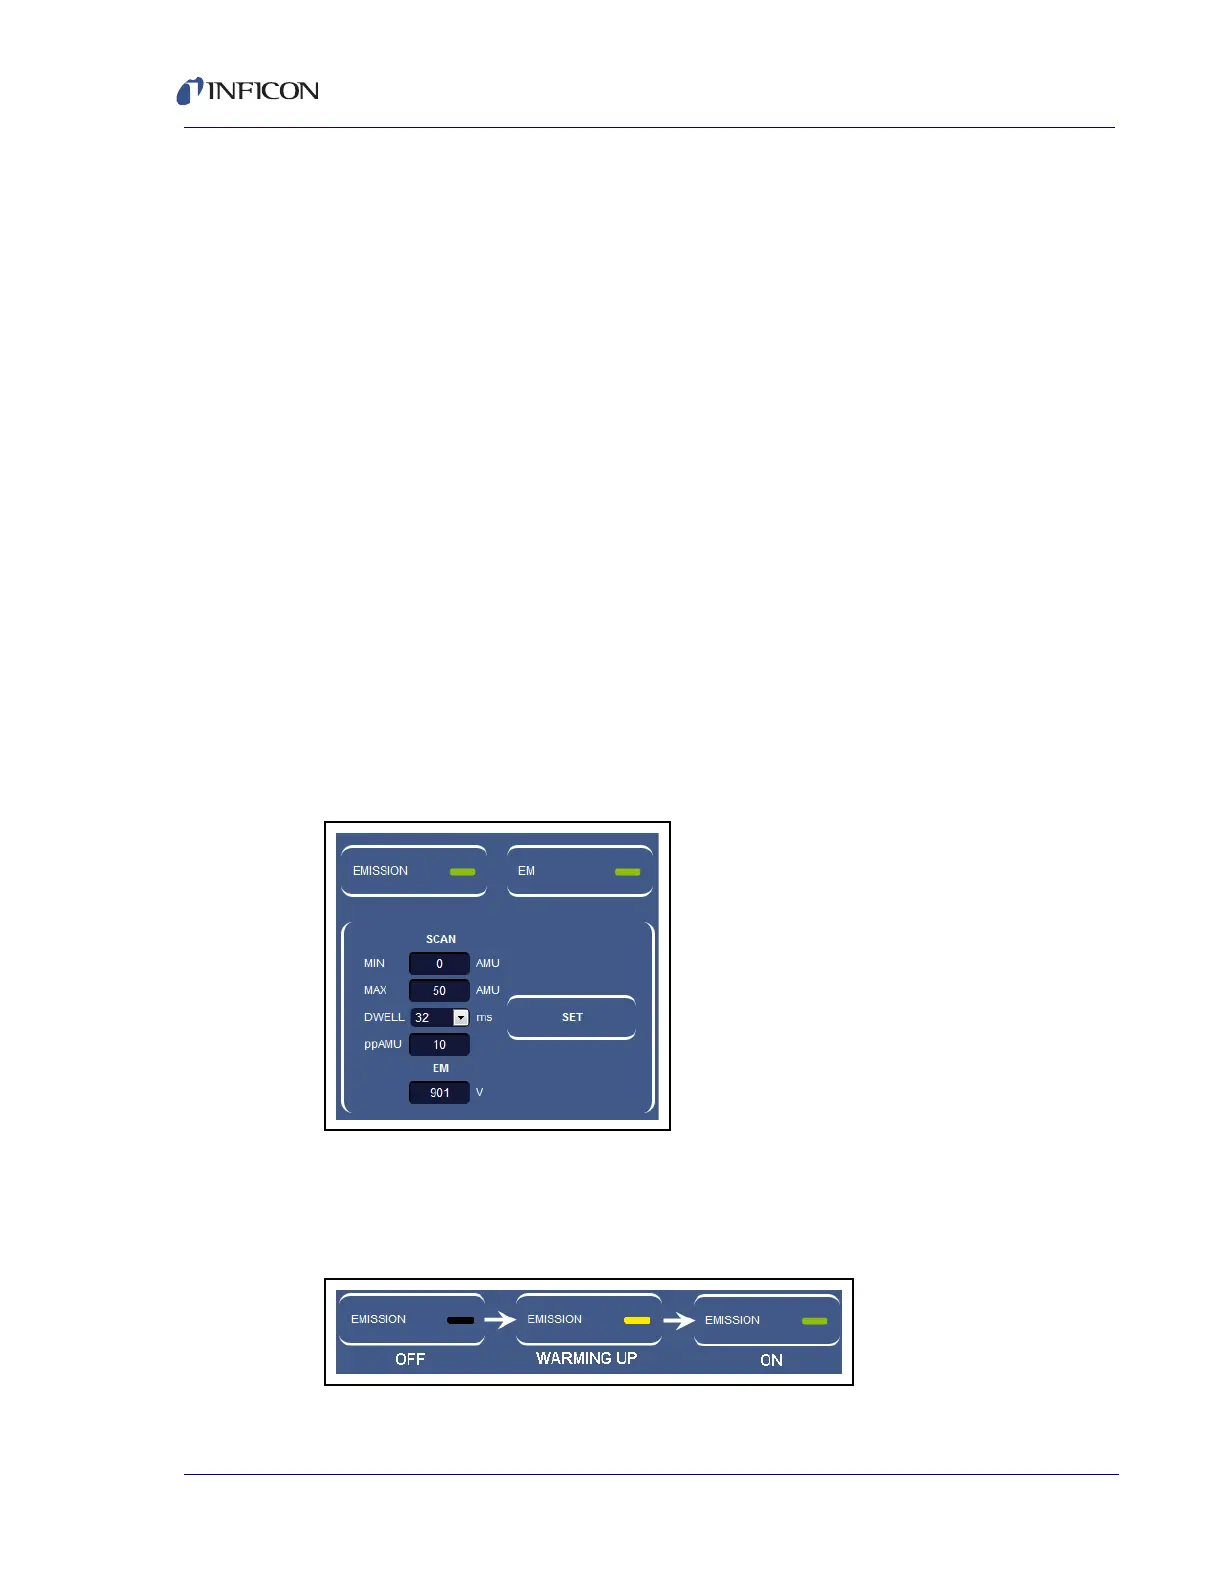
5.5.2.1.2 How To Change Scan Parameters
On the right side of the MONITOR window is a group for controlling EMISSION and
EM. See Figure 5-9. In this group are editable boxes that change the scan
parameters described in section 5.5.2.1.1.
Figure 5-9 Where to change scan parameters
To turn On/Off Emission, click EMISSION. There is an indicator on the right side of
the EMISSION button. This indicator changes color based on emission state.
There are three colors, as shown in Figure 5-10.
Figure 5-10 Emission status