SETUP – Configuring Monitor Parameters
5867B_002-626e-04.16 Page 45
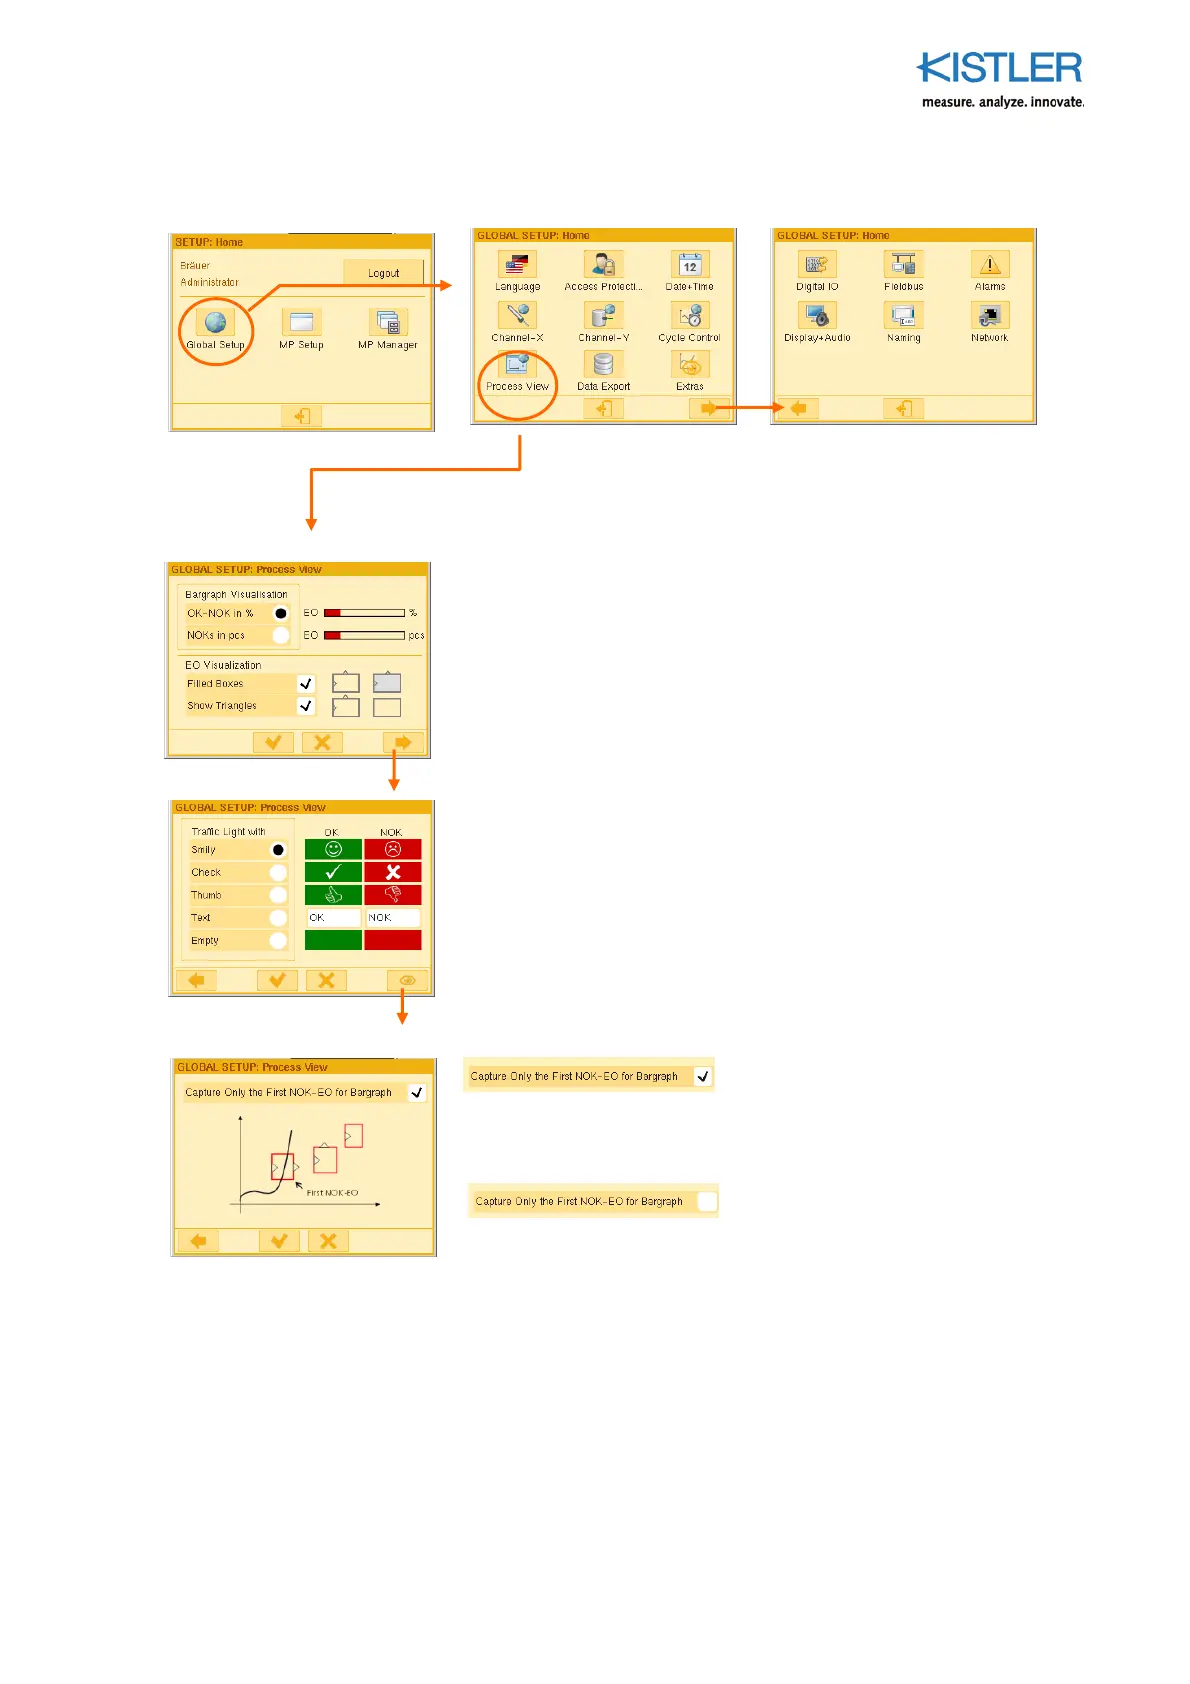
4.3.6 Specifying Process View
Specifying the form of representation for:
1. The bar graph of the PROCESS page "OK-NOK Distribution"
2. The evaluation objects UNI-BOX and ENVELOPE on the PROCESS
page "Current Measurement Curve"
Choose a Traffic Light view here. The "Text" option can be used to
enter any text, e.g. GOOD / NOT OK (NOK) to be shown on the green
or red traffic light. Click the relevant field to enter the text!
Capture Only the first NOK EO for Bar Graph
Working from the starting point of the measurement curve, only the first
EO causing an NOK is included in the bar graph statistics "OK-NOK
Distribution".
All of the NOK EOs are included in the bar graph statistics, even if they are
not the cause of the problem (see also p. 46).
 Loading...