SETUP – Configuring Monitor Parameters
5867B_002-626e-04.16 Page 79
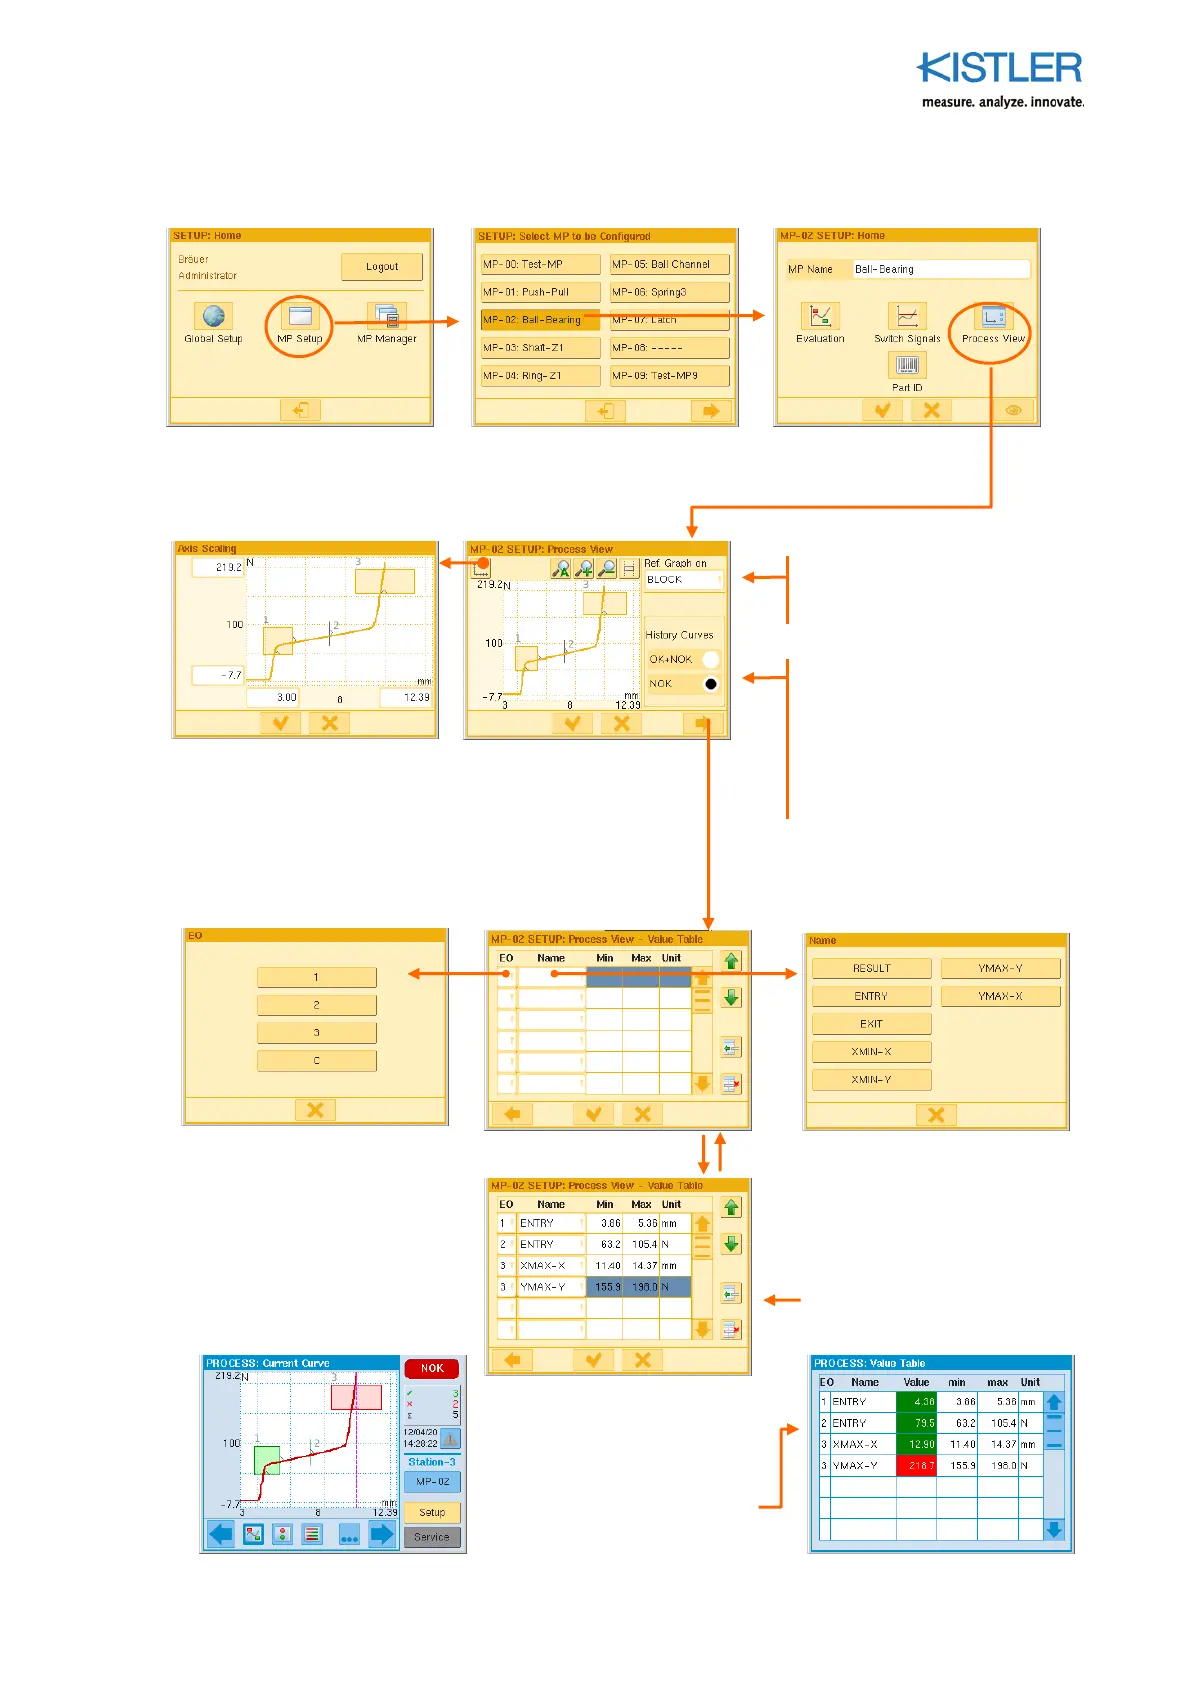
4.4.7.1 Specifying Process View
4.4.7.2 Setting Scaling, Specifying Reference Point for Graphs of Curves
4.4.7.3 Choosing Process Value Source for Value Table
As in the EO Editor, you can
also specify the reference
position for the curves here.
Ti
: If you choose NOK here,
only the NOK curves of
im
ortance to diagnostics are
"collected". Subse
uent OK
curves then do not
ush
these out of the memory
again (FIFO)
The entry fields on the axes
can be used to set an individual
scaling value
Ta
the "EO" field and
choose the EO whose
rocess
value you want to have
displayed. "K" means curve-
related values, i.e. values
independent of EO.
Ta
the "Value name" and
choose a
rocess value that
the chosen EO is to
subse
uently dis
lay in the
value table.
Re
eat this
rocedure until all
of the required
rocess values
are in the list.
Method of dis
laying
rocess
values of EOs of current
measurement curve (left
screenshot) in
rocess value
table of the (blue)
rocess
LEVEL (right screenshot)
 Loading...