Version 1.10 Pag. 184 di 203
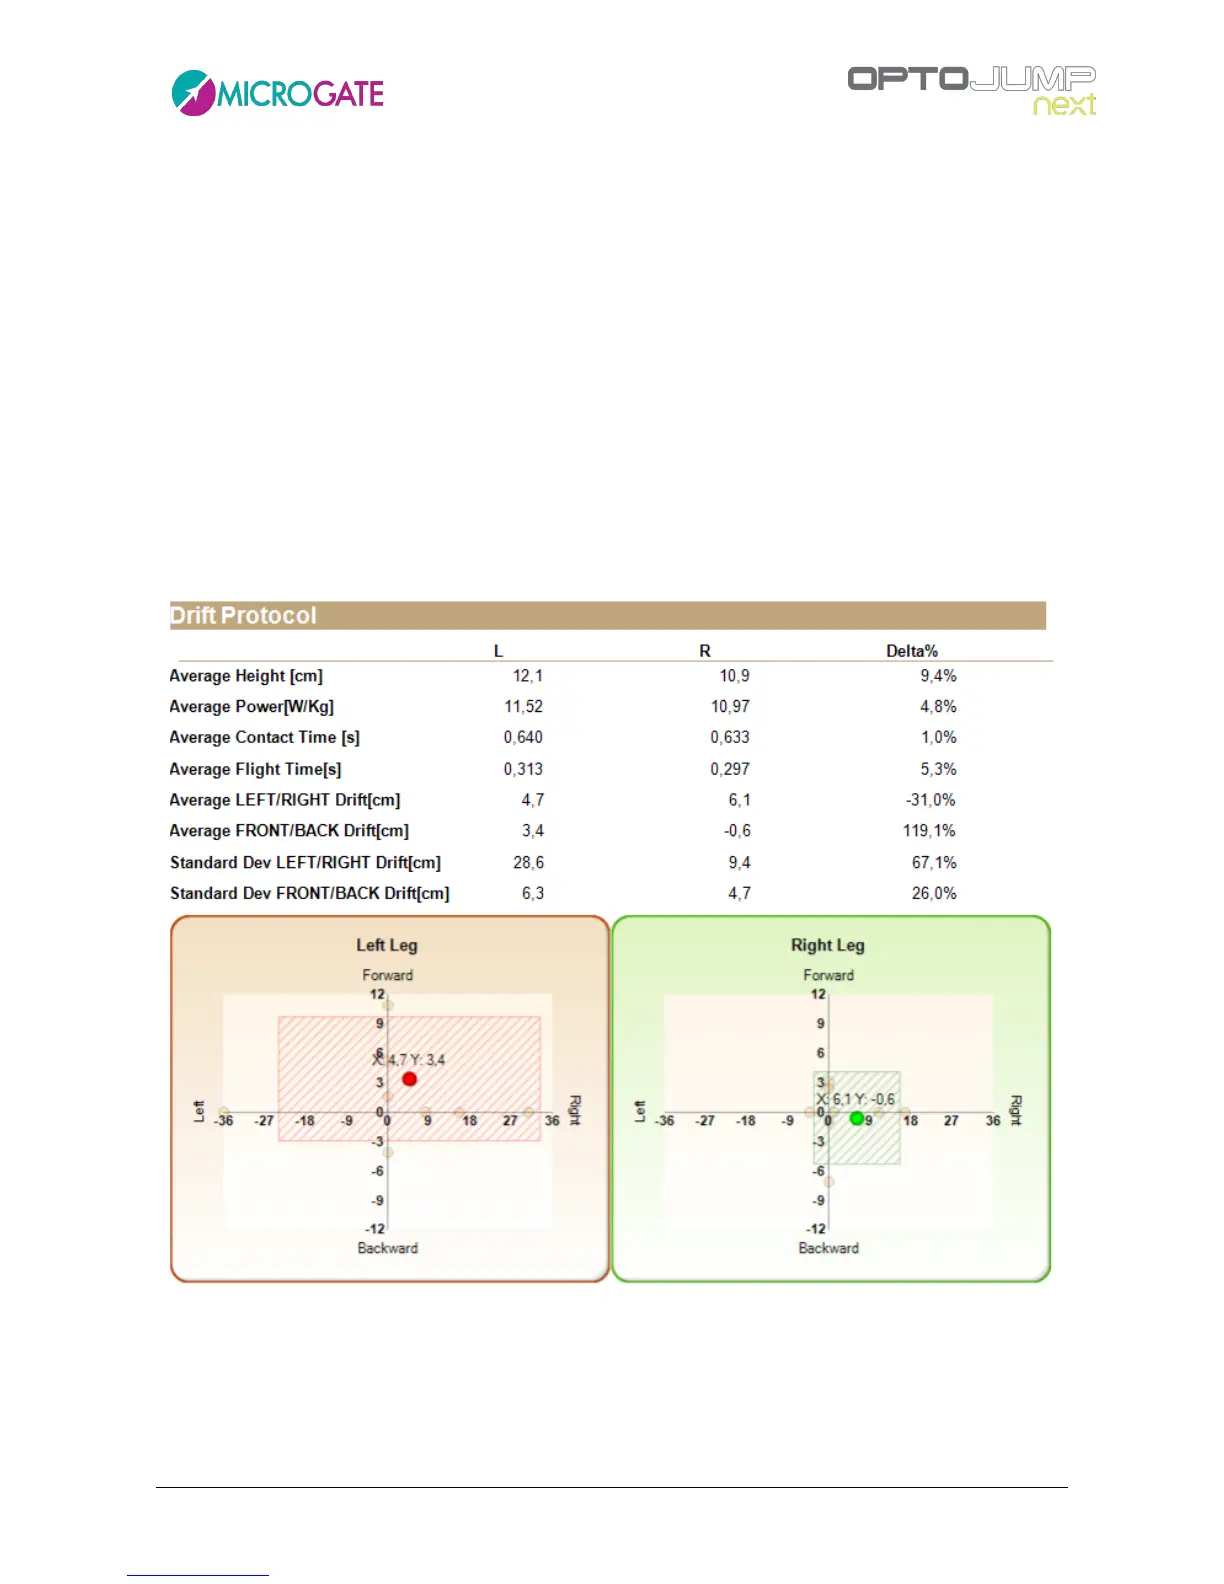
Each jump is displayed as a yellow dot (if you can not see 10 dots per leg some might be superposed);
the two large red and green dots (left and right) represent the athlete's tendency to move into a
certain direction (e.g. upwards to the right), whereas the dotted triangle indicates the 'stability
area'.
The position of the red and green dots with reference to the origin of the two Cartesian axes gives
a first indication of the athlete's average landing point compared to the starting point. As these are
average data, their position could be misleading: for example, given the absurd assumption that an
athlete carries out a perfectly central jump, two completely to the right and two completely to the
left with two displacements of exactly the same entity, the dot will be placed exactly in the center
giving the impression that the athlete always jumped perfectly.
But in this case the rectangle with the dotted area representing the standard deviation of jumps
can be helpful. The larger the displayed area, more has the athlete drifted (moving away from the
point of origin) when landing, and as a consequence his dynamic stability is lower.
Figure 123 - Drift protocol report output