Version 1.10 Page 85 of 203
The Data Window allows us to decide every how many events a calculation to work out which of the
three bands the patient falls into; e.g. by setting 5 DATA, every 5 steps (or jumps) the average of the
selected measurement is calculated, compared with the reference value and the established
thresholds and assigned to the good, warning or bad category.
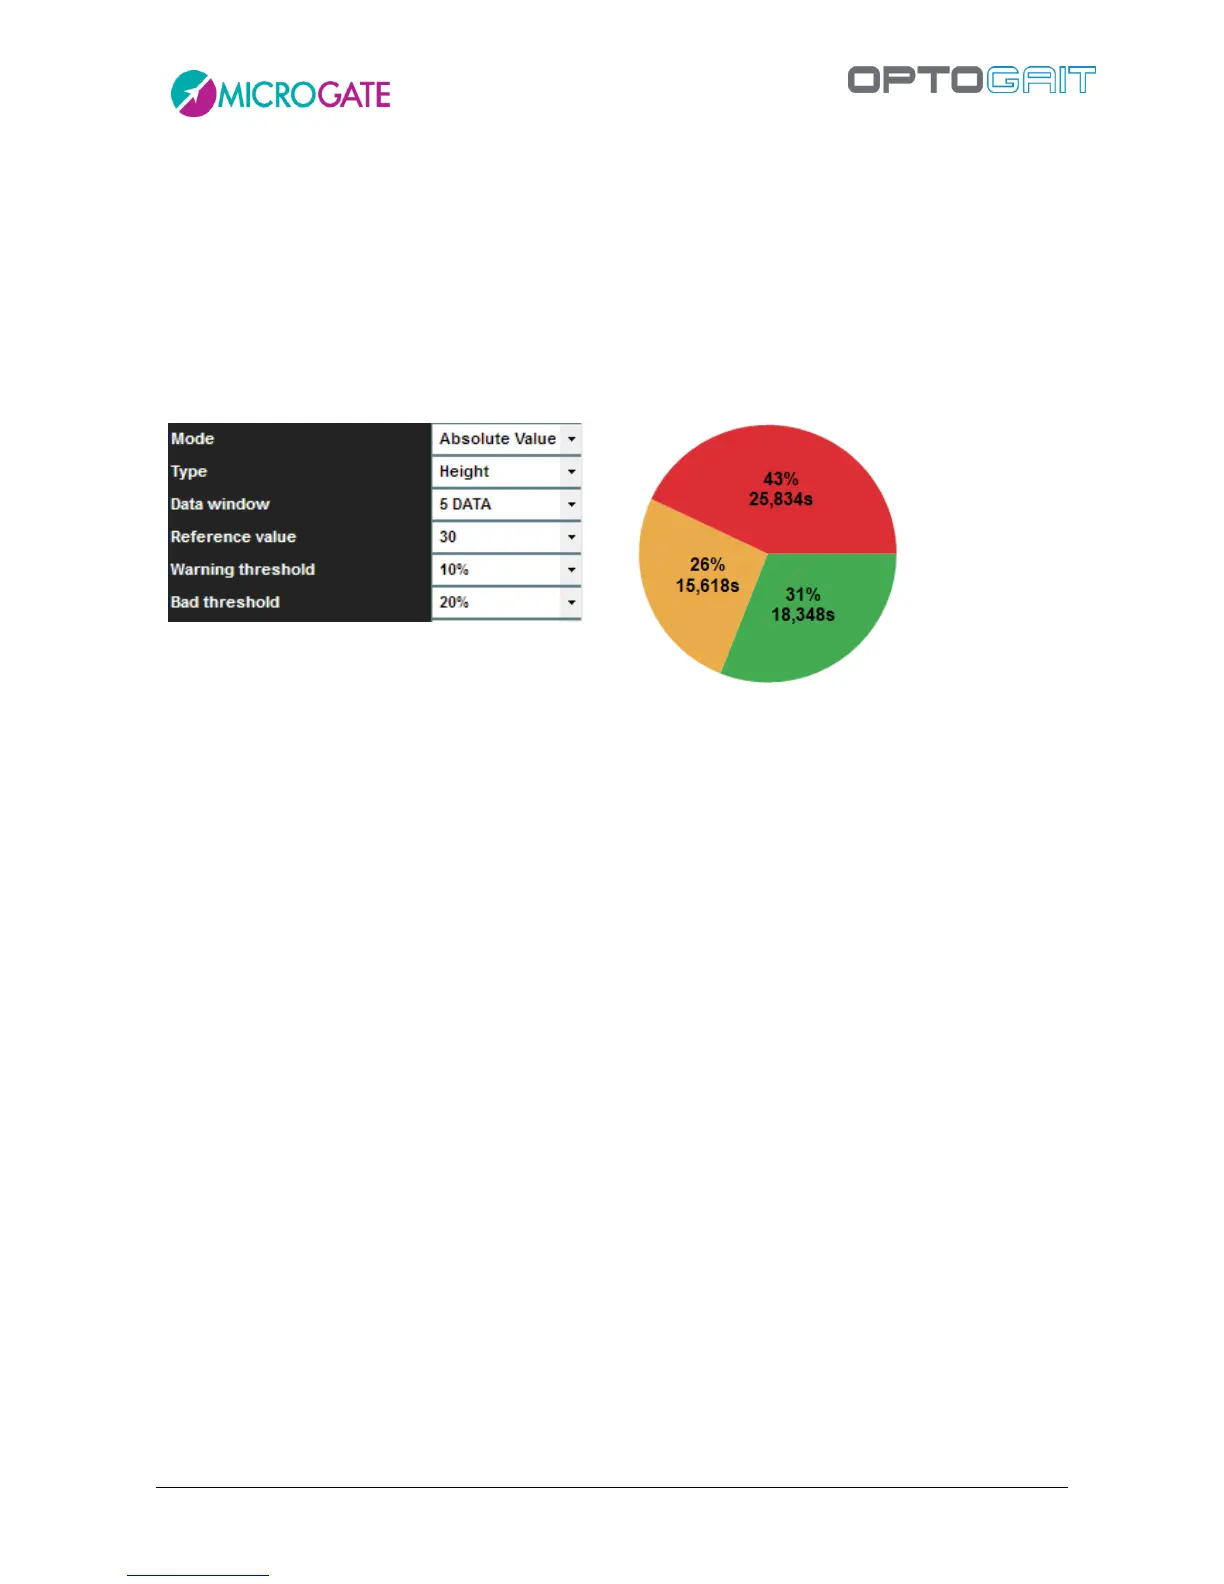
In this second example, however, we see the use of 'Absolute Value' mode where, in a 'Jumps 60
seconds' test, the Height value is compared with a reference value of 30 cm: 31% of the time the
patient jumped over 27 cm (30 cm – 10% of the warning threshold), 26% of the time he/she jumped
between 24 and 27 cm, and 43% of the time he/she jumped under 24 cm.