MSB780(X) - User’s Guide
Here you can see file name and time/date of storing file (not begin of recording). You can tap
"DELETE FILE" which deletes the file after approving with YES button or tap "SHOW GRAPH"
which leads to this screen:
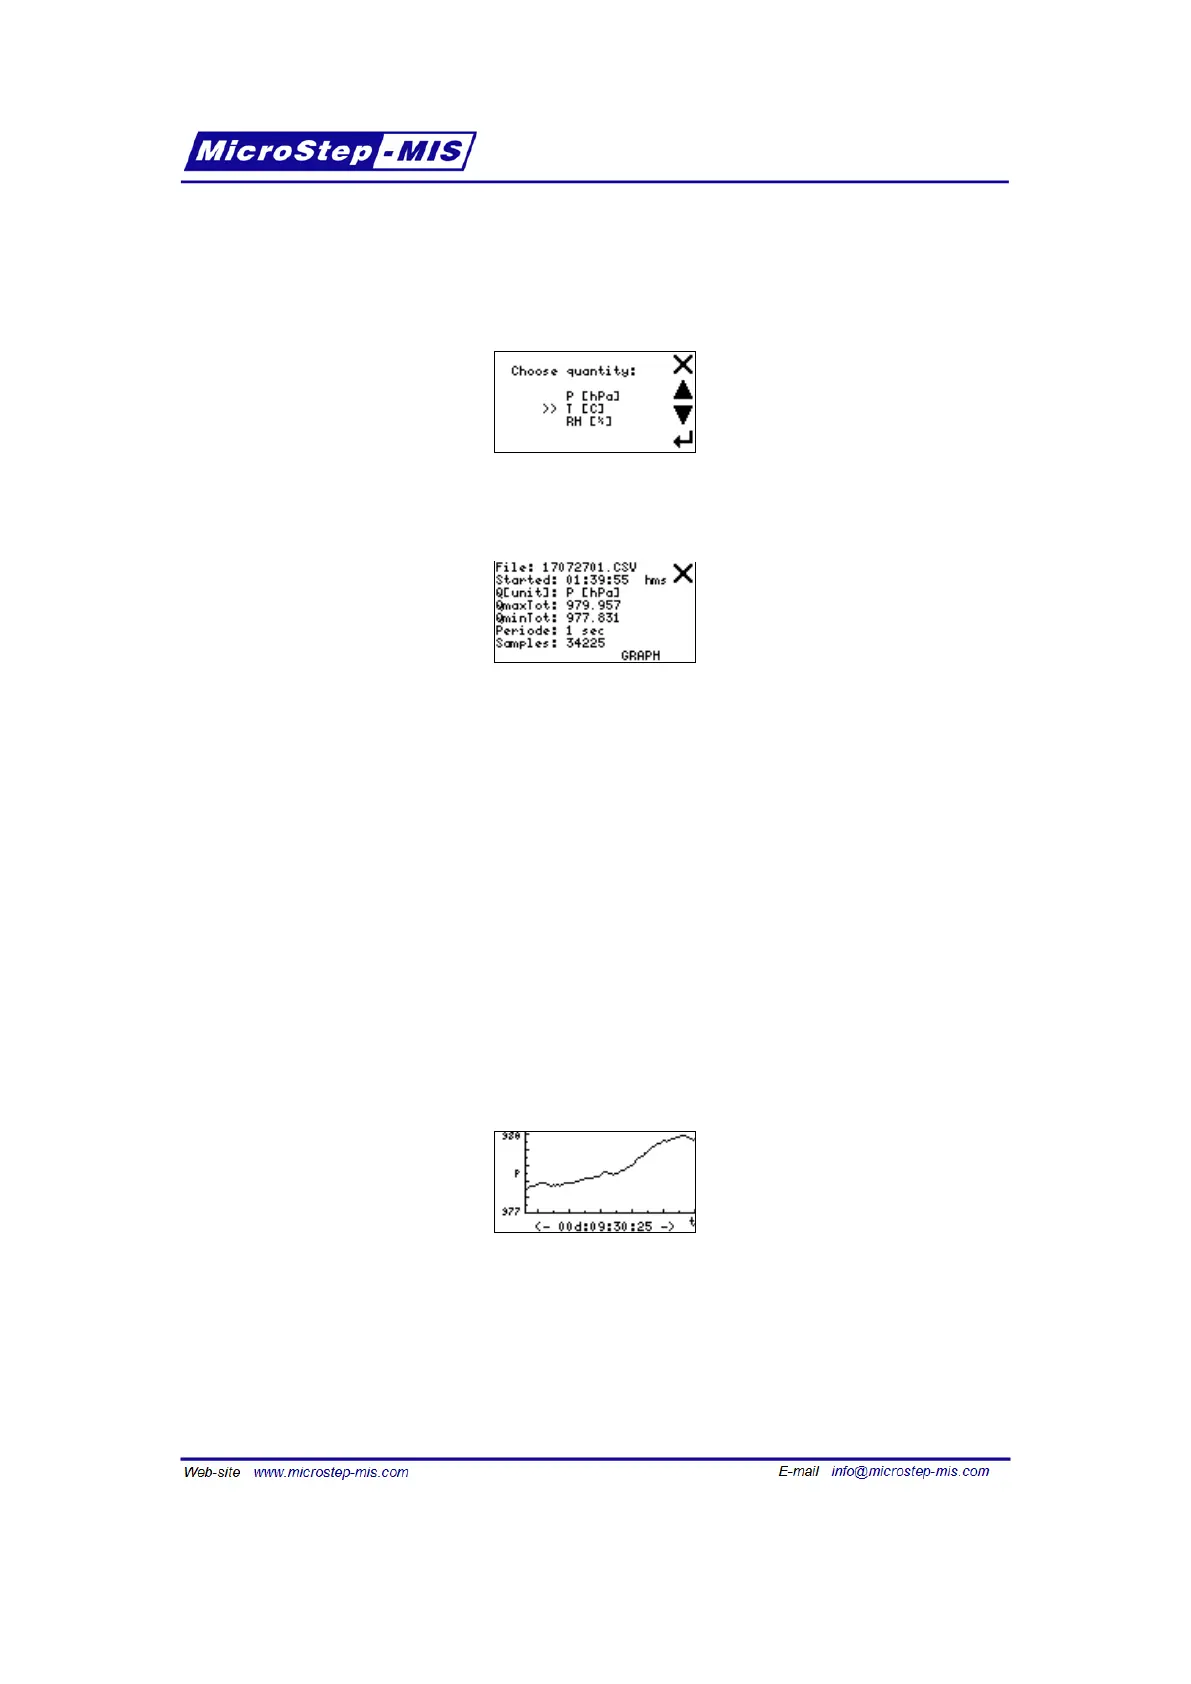
Select the quantity to plot. When the barometer processes the data you can see more details:
• File: file name, i.e. also date of start (yymmdd)
• Started: start time of record, i.e. time of the first sample (hh:mm:ss)
• Q[unit] selected quantity and its unit (applies also for next min/max values)
• QmaxTot total maximum of selected quantity (see note below)
• QminTot total minimum of selected quantity (see note below)
• Qmax gr maximum of graph scale (see note below)
• Qmin gr minimum of graph scale (see note below)
• Periode sampling periode of record
• Samples count of recorded samples within the file
Note: "Qmax gr" and "Qmin gr" are shown here instead of "QmaxTot" and "QminTot" when they
do not fit in graph view numerically (if they are more than 4 digits long after rounding to whole
number).
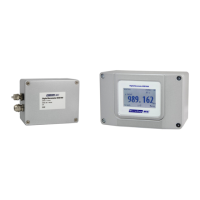
Tap the GRAPH button to show graph.
Example:
Tap anywhere on the screen to get back to previous screen with details.
Periode screen
In this submenu you can enter new sampling periode for recording. The change will apply when
new recording is started. You can find actual value in "Recording" screen.
63