Item Description
Calibration
icon
The approximate time left until your next sensor calibration is due. The
calibration icon appears only when the Sensor feature is turned on.
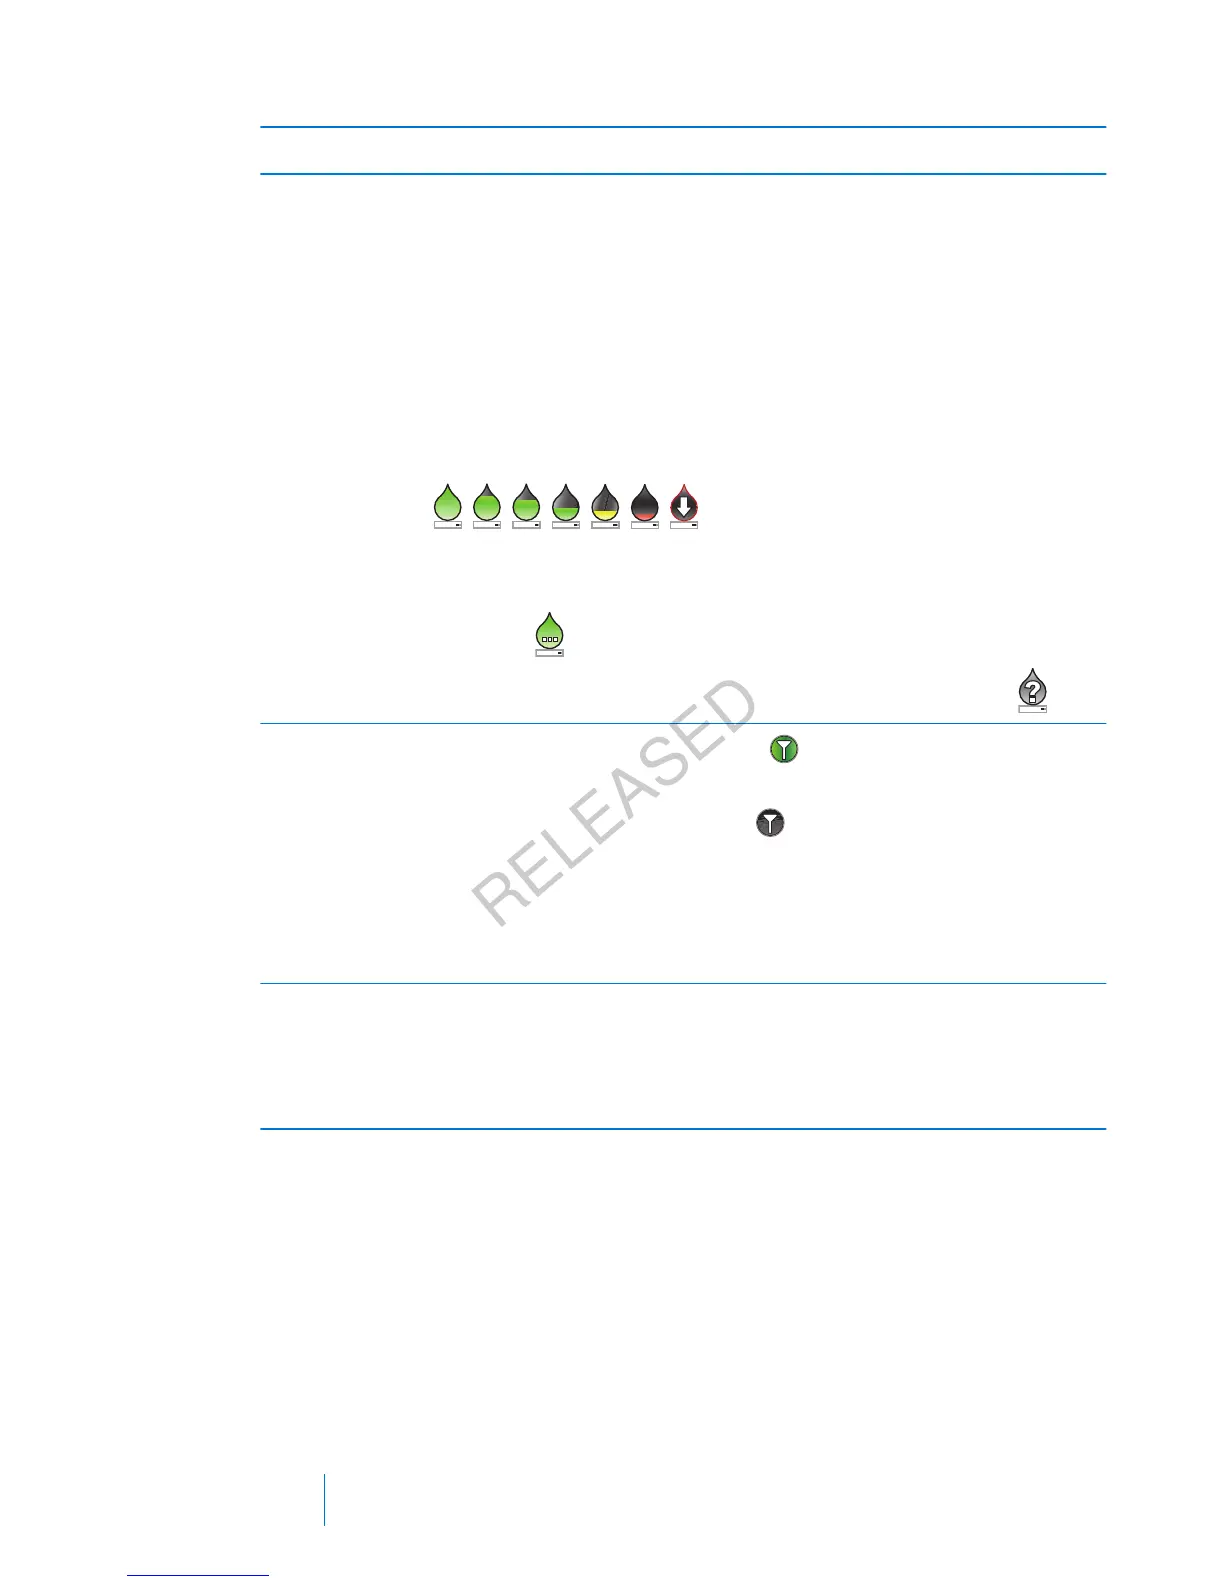
The color and the fill level of the icon indicate the status. When your
sensor is fully calibrated, the icon is solid green. As the time for your
next sensor calibration approaches, the icon becomes emptier, and
the color of the icon changes as shown in the following example. For
more information about calibrating your sensor, see Calibrating your
sensor, on page 184.
When your sensor is initializing, the Calibration icon appears with
three dots
. If the time to your next sensor calibration is
unavailable, the Calibration icon appears with a question mark
.
Connection
icon
The connection icon appears green
when the Sensor feature is on
and your transmitter is successfully communicating with your pump.
The connection icon appears gray when the Sensor feature is
turned on, but the transmitter is not connected or communication
with your pump has been lost. For more information about the Sensor
feature, see Understanding Continuous Glucose Monitoring (CGM), on
page 151.
Sensor graph Displays your SG readings over a period of 3 hours. The red lines
represent your high and low SG limits. The blue line represents your
SG trends during the specified period. For more information, see The
sensor graph, on page 191.
154 Chapter 10
MP6025957-024 / A
RELEASED