The left and right arrow keys can also be used to
scroll between data points.
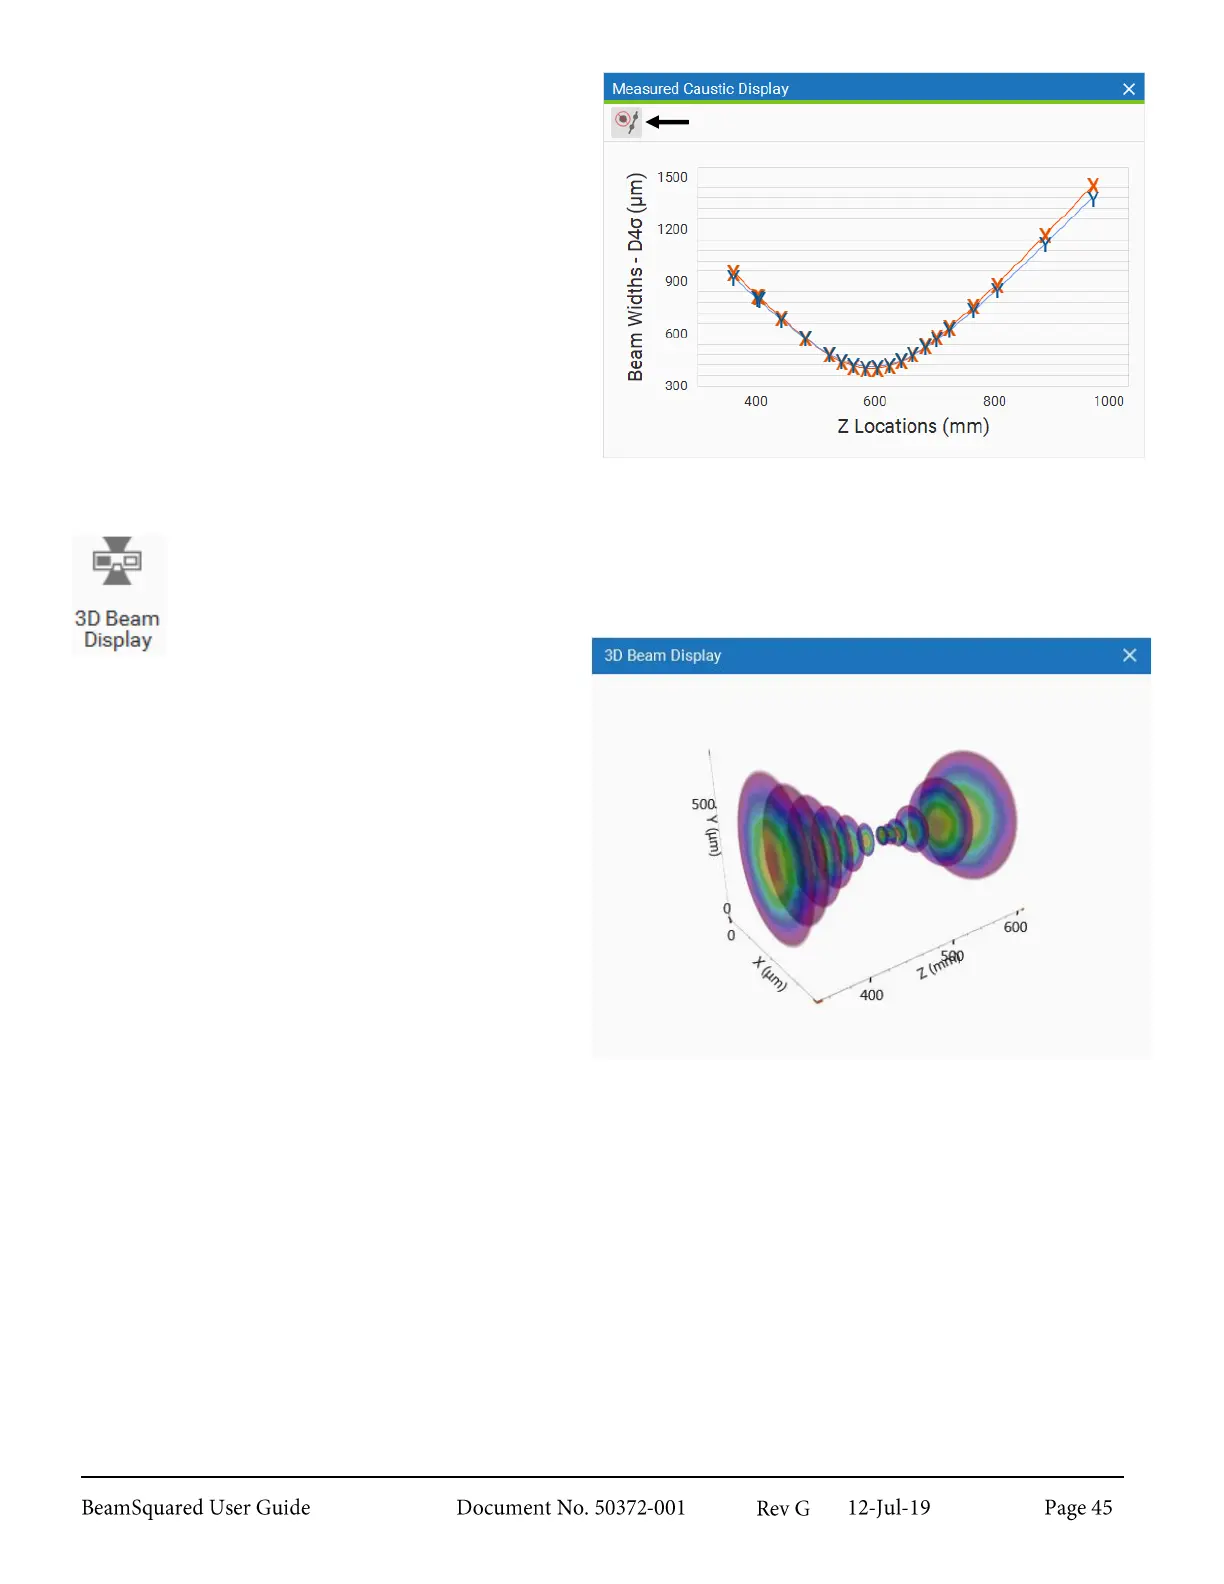
Enable/Disable Auto Outlier Removal in the top
left corner of the window to have anomalous data
points automatically excluded from the M
2
calculations. Automatically excluded points appear
purple. This feature is on by default. We
recommend its use as it will eliminate most, if not
all, of the collected anomalous data points.
Double-click a data point to manually exclude it from
the M
2
calculations. Manually excluded points appear
gray. Double-click again to include it.
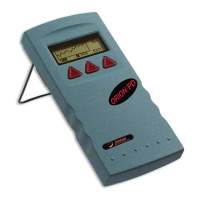
3D Beam Display
3.7.3
The 3D Beam Display provides a 3D representation of the beam made up of the frames taken
during a run. Each slice represents a data point in the Measured Caustic Display plot.
Left-click and drag anywhere in the display to
rotate the image.
Right-click and drag anywhere in the display to pan
the image.
Zoom in and out by scrolling forward or back on
the mouse respectively.
Select any point in the Measured Caustic Display to view it in the 3D Beam Display. Selected points are
indicated in the 3D Beam Display by a red circle.
Manually excluded points appear gray in 3D Beam Display, automatically excluded points appear purple. In
the example below, the first point has been manually excluded and the third and seventh points have been
automatically excluded.