Data Collection in Auto Mode 4.3
Select Start from the run ribbon to begin collecting frames. The system activates and begins collecting frames
until the run is complete or you select Pause.
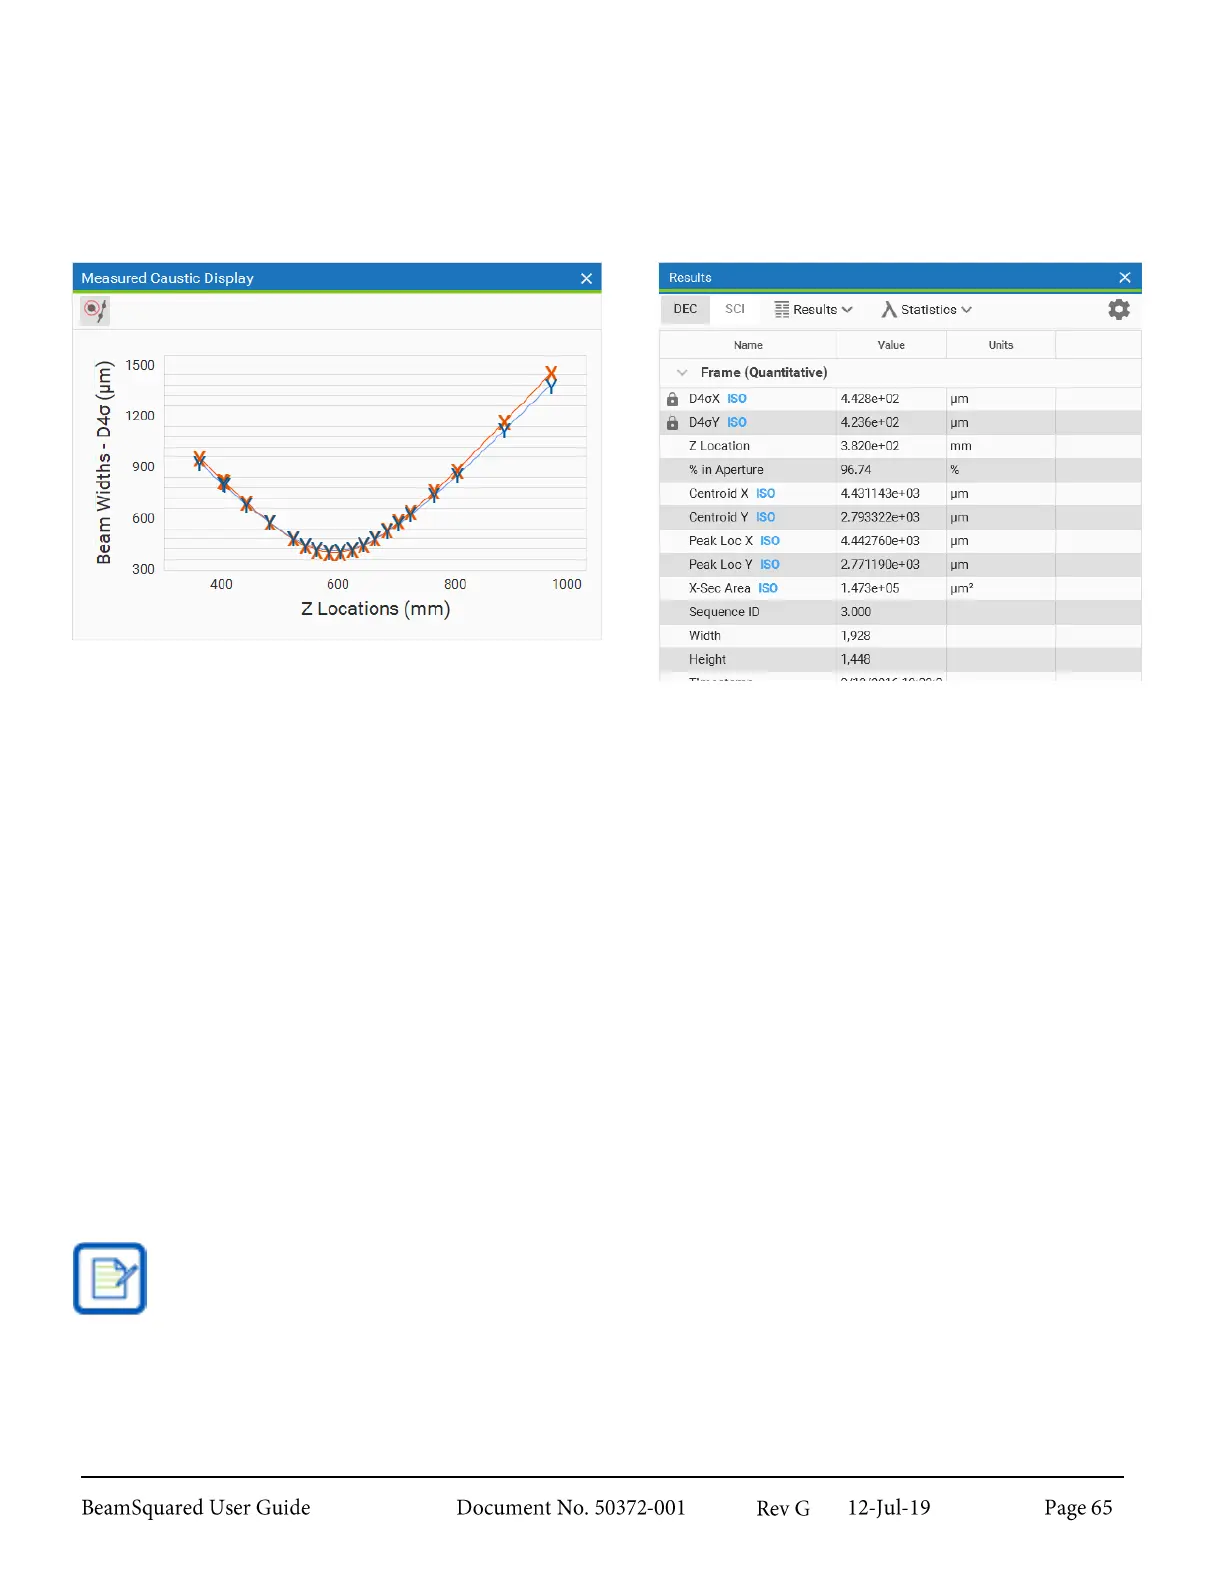
Data points begin to be plotted on the Measured Caustic Display. A curve fit plot appears when the system
has acquired enough data to make a strong estimation. The results update as data is collected.
Useful Operations and Functions 4.4
The following information describes topics that may be of less obvious value to the user.
Z Locations 4.4.1
During an M
2
run, some Z locations may not provide reliable measurements. The frame quality check in the
Step by Step wizard notifies when concerns are detected.
When configuring Start and Stop locations there are inaccessible locations at each end of the translation
space. The Start location must be greater than the minimum accessible location and the Stop must be less
than the maximum.
Plotted Curve Fit 4.4.2
The X and Y axis results are reported and computed simultaneously. Two data points for each location and
two plotted fits to the data appear in the caustic window. This plot shows the beam widths as functions of Z
location. Z location is the distance from the lens to the camera image plane, so the plot has reference to the
focused beam as seen in the beam sampling diagram below.
If using the EPSA beam width basis, the X and Y values in the caustic plot will overlap. Because of
the always circular beam width measurement method, both axes will always report the same values.
Thus it is only recommended for use with round beams.