User’s Manual of GS-5220 LCD Series
125
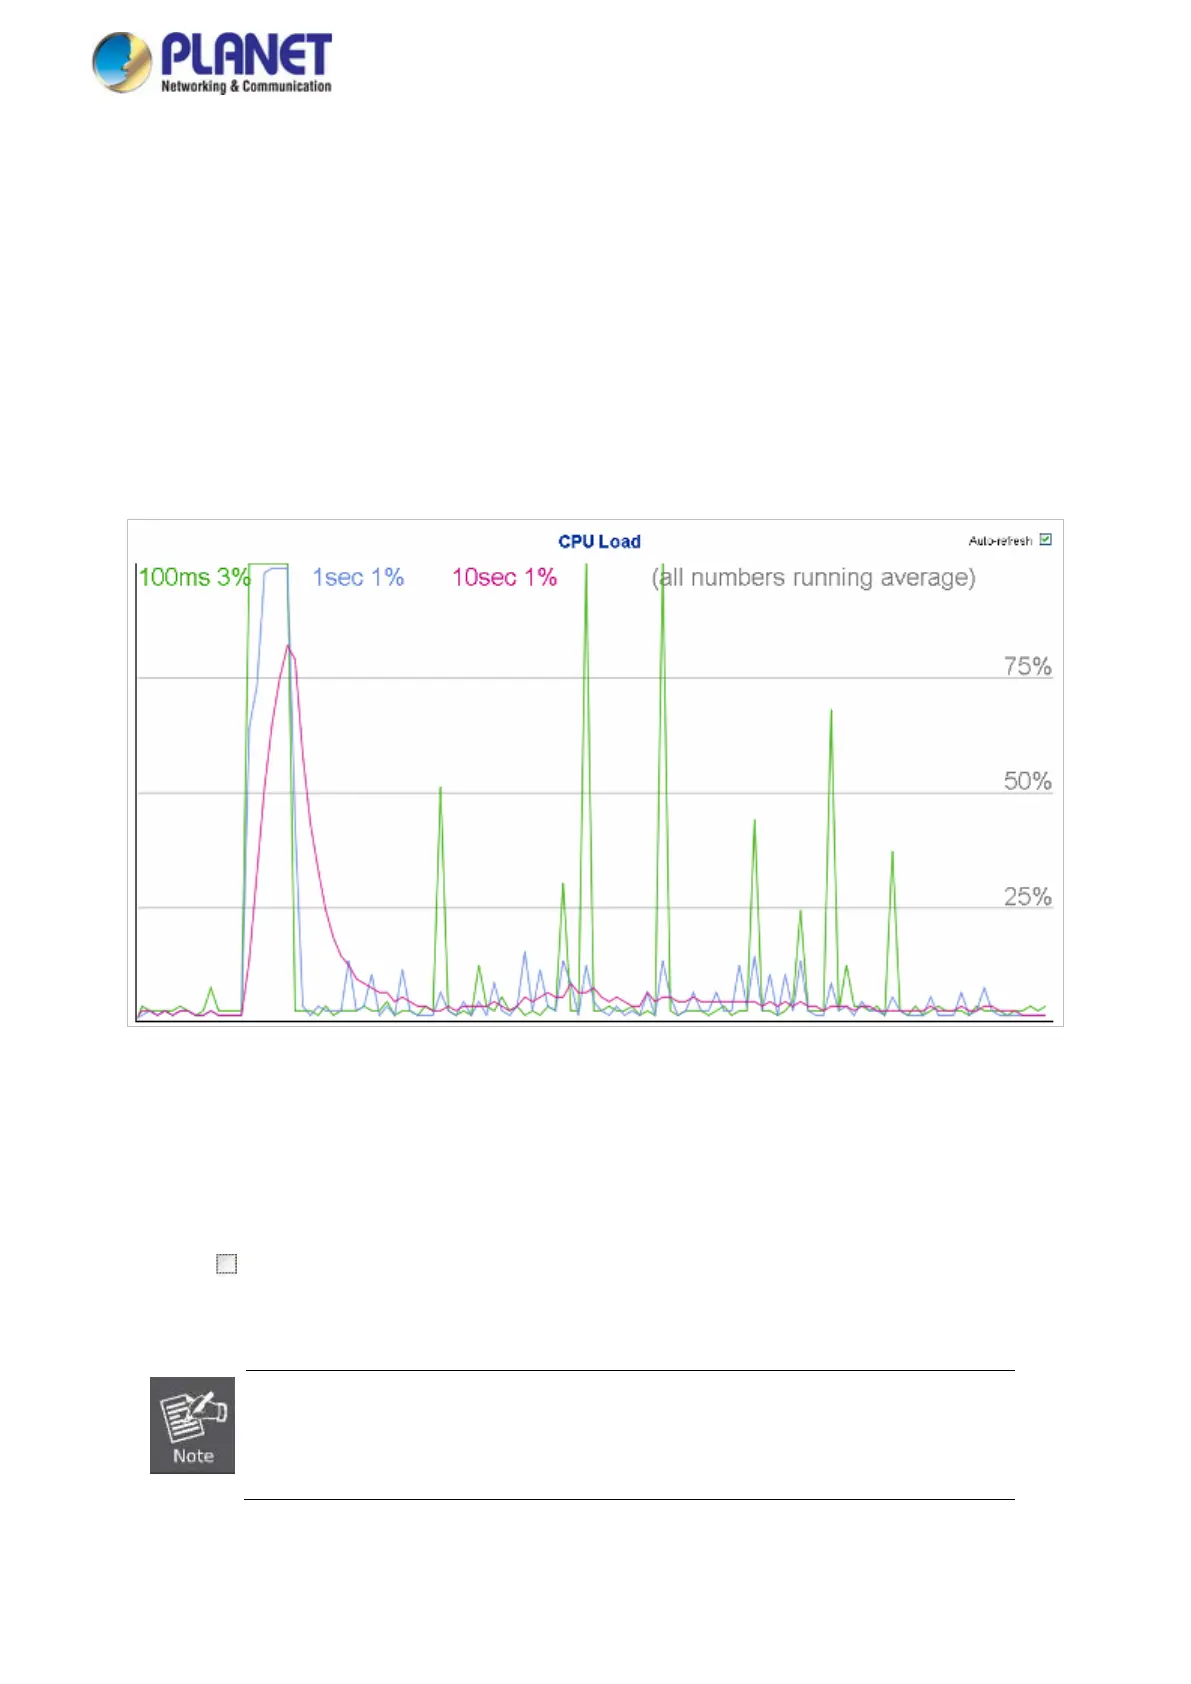
4.2.11 CPU Load
This page displays the CPU load, using an SVG graph. The load is measured as average over the last 100ms, 1 sec
and 10 seconds intervals. The last 120 samples are graphed, and the last numbers are displayed as text as well.
In order to display the SVG graph, your browser must support the SVG format. Consult the SVG Wiki for more
information on browser support.
Specifically, at the time of writing, Microsoft Internet Explorer will need to have a plugin installed to support SVG.
The CPU Load screen in Figure 4-2-14 appears.
Figure 4-2-14: CPU Load Page Screenshot
Buttons
Auto-refresh
: Check this box to refresh the page automatically. Automatic refresh occurs every 3 seconds.
If your browser cannot display anything on this page
, please download Adobe SVG
tool and install it in your computer.
 Loading...