4-16
VIBXPERT 11.2010
B1. Display Setup for measurement: Spectrum / Time waveform
ZOOM:Step size when zooming the X and Y-axis.
Zoom Mode: The zoom is made around the main cursor or the gap
between the delta and main cursor.
C
URSOR: Short cursor or line cursor (long); line type for the line cursor.
D
IAGRAM TYPE: A spectrum can be displayed in a curve diagram or a bar
chart. A time signal can be displayed in Cartesian coordinates (X-Y
diagram) or on a circular plot. When taking measurements with
DC coupling, the DC component in the signal can be hidden
(Option: ‘AC only’).
S
UFFIX FOR 1/1000 OR 1000: Instead of '1/1000' or '1000', the X-axis
can be labeled with the abbreviation 'm' (milli) or 'k' (kilo).
A
MPLITUDE (SPECTRUM): Amplitudes in RMS or peak values (0-peak,
peak-peak). RMS value of entire spectrum: see p. 4-11.
O
RDER DISPLAY (SPECTRUM): Scaling of the X-axis in Hz (No) or orders
(Yes). The shaft RPM must be known (measured or entered).
A
MPLITUDE SCALING (SPECTRUM): linear or logarithmic (in decibels).
D
EFAULT DISPLAY MODE (SPECTRUM): Information that appears in the lower
display field by default (Max 10, time waveform, band alarms,
frequency marker, trending parameters, cursor coordinates).
S
PEED MARKER (TIME SIGNAL): Display of the trigger signals in the
diagram. In the circular diagram, the arrow indicates the direction
of rotation.
C
ONTINUOUS MEASUREMENT (LIVE MODE): see section X on page 4-15.
B2. Display Setup for Trend: Spectrum (Waterfall diagram)
CURSOR & AMPLITUDE: s. section B1; in a waterfall diagram, a grid can
be superimposed for easier evaluation of the data.
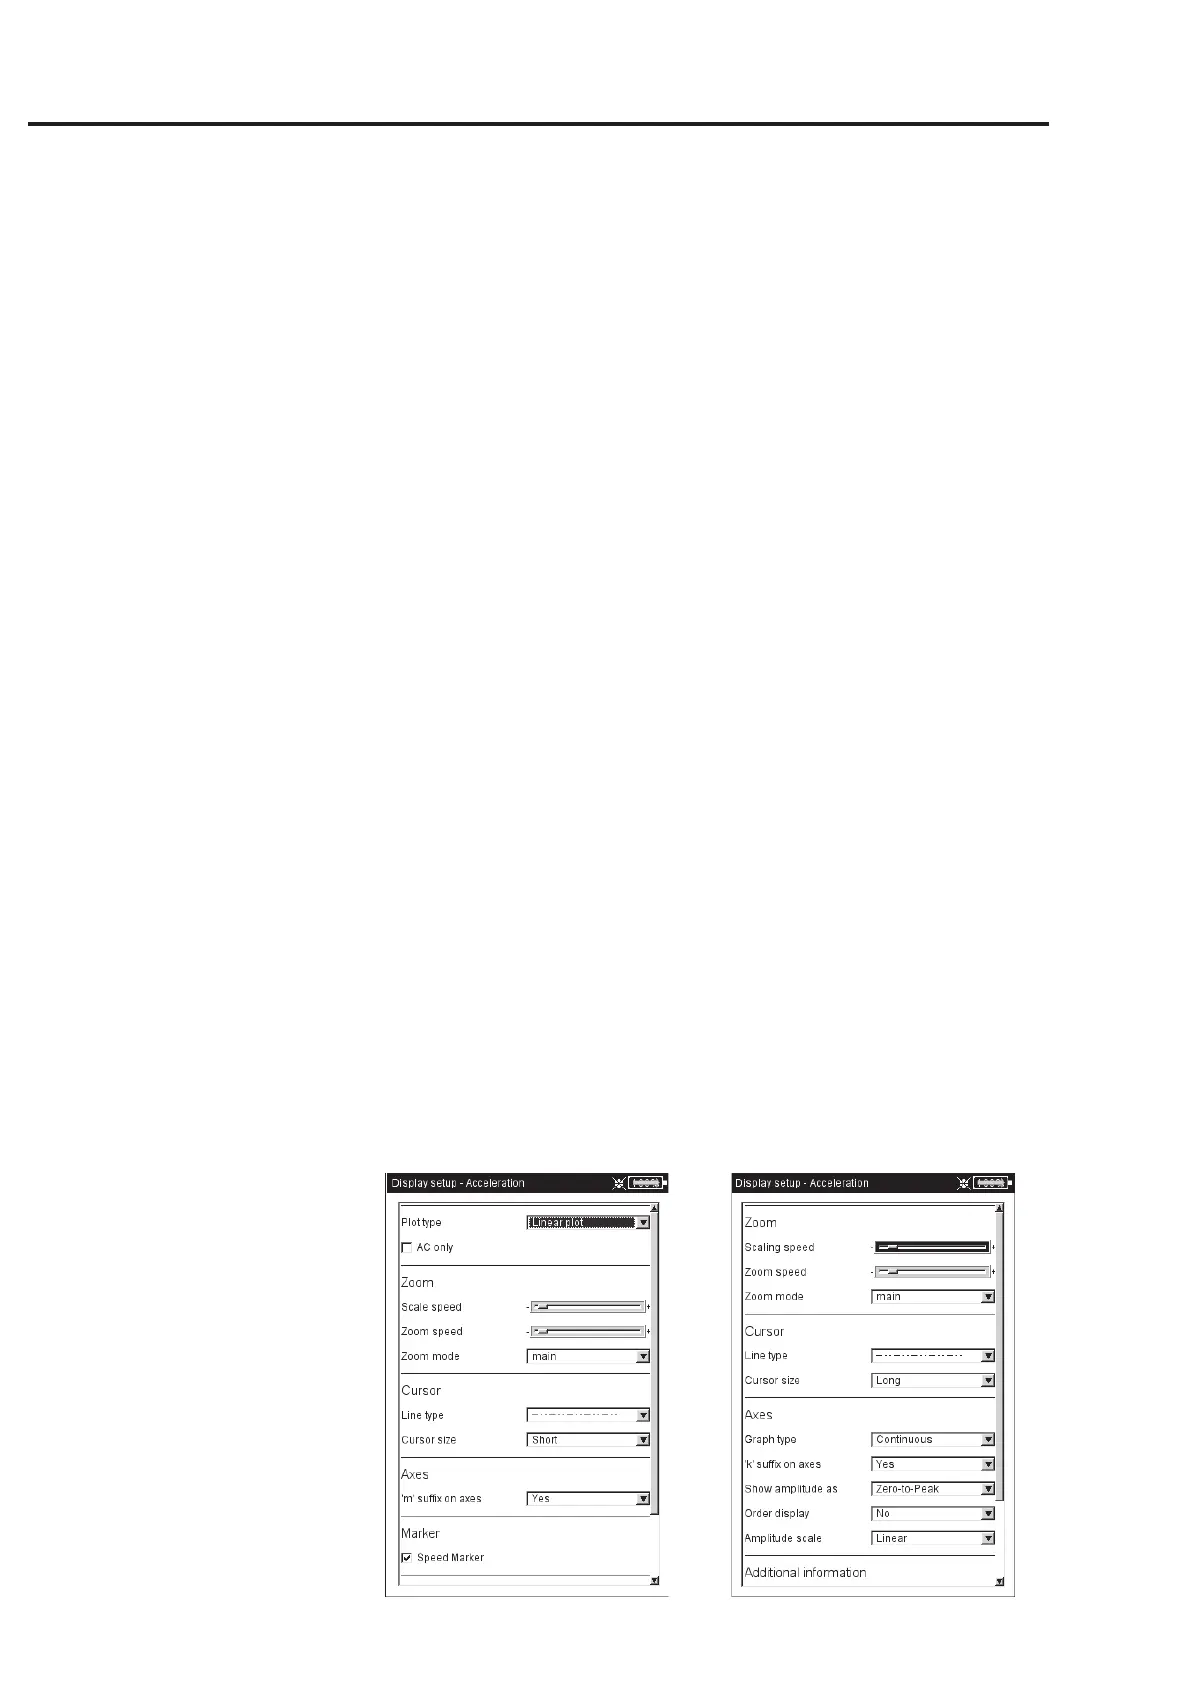
Display setup
Left:
Display setup for time waveform
Right:
Display setup for spectrum
 Loading...