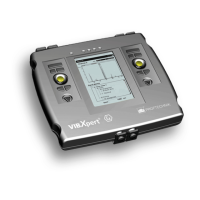
4-15
VIBXPERT 11.2010
Configuring the result display (Display Setup)
In the Results display, after a measurement:
• Press the MENU key and click on 'Display Setup'.
In the selection field of the measurement tasks (Multimode):
• Highlight the measurement task symbol.
• Press the MENU key and highlight the 'Display Setup' entry.
• Move the joystick to the right and click on 'Measurement' or
'Trend' respectively (s. below).
X. Continuous measurement (‘live mode’)
In ‘Live mode’, you can check the signal quality before beginning with
data collection (see p. 3-4).
A1. Display Setup for measurement: Overall values
DISPLAY LIMIT AS...: The limit values can be displayed as an absolute
value or as a difference ('Delta value') to the measurement value.
D
ISPLAY OVERALL PEAK VALUE: Select the characteristic vibration value that
is to be displayed by default with the 'RMS value'. After the
measurement, move the joystick repeatedly upwards to display
the overall values of the series that were not displayed. If the
threshold is exceeded, the RMS values and the overall value that
exceeded the threshold by the largest amount are displayed.
A2. Display-Setup for Trend: Overall values
MEAS. VALUE: Selection of overall values. The line type can be selected
and the labeling can be shown for each trend curve.
S
HOW...: Limits, event markers, references and the associated labeling
can be displayed in the chart. The line type can be selected.
Z
OOM: Speed or step size when zooming
L
AYOUT: The values on the trend curve can be identified with markers.
A grid can be displayed for easier evaluation of the data and the
cursor can be displayed as a cross (short) or line cursor (long).
Display setup
Display Setup for overall values
(more than two overall values)
Left:
Opening the Display Setup
before a multimode measurement
Right:
Display Setup for Overall Trend
 Loading...