4-17
VIBXPERT 11.2010
Display setup
C1. Display Setup for measurement: Coastdown, Orbit, Phase
The following sections C and D only describe the parameters specific
to the measurement type. Global display parameters, such as 'Zoom'
and 'Cursor', can be found in sections A and B.
S
HOW OVERALL (COASTDOWN - OVERALL VALUE): The results screen displays
two diagrams, RMS value and peak value in dependence on the
RPM. Select the peak value which is to be displayed as standard.
P
LOT TYPE (COASTDOWN - PHASE): The runup / coastdown curve can be
displayed as a Bode or Nyquist plot. Orbit (polar representation)
and single signals (Cartesian representation) can be selected for
the shaft movement. The AC only option shows the AC compo-
nente of the signal.
S
HOW AMPLITUDE AS (COASTDOWN CURVE - PHASE VECTOR): Amplitudes can be
displayed as an RMS value or a peak value (0-p).
C
ONTINUOUS PHASE (COASTDOWN - PHASE WITH BODE PLOT): The scale of the
phase axis begins at 0° and ends at 360°. If the curve runs beyond
the 360° mark during the measurement, it is continued unchanged
at 0° (No). If you select the Yes option, the phase axis continues
beyond 360° - beginning again at 0° - and the phase progression is
continually displayed.
S
PEED MARKER (ORBIT): See section B1.
A
NGLE DIRECTION (COASTDOWN CURVE - PHASE VECTOR, PHASE MEASUREMENT):
This parameter is primarily used in displaying the coastdown
curve in the Bode plot and determines the direction of rotation of
the phase measurement. Select whether the phase should be
displayed before or after the trigger mark.
A
NGLE TYPE (COASTDOWN - PHASE, PHASE MEASUREMENT): The angle type
indicates whether the synchronous phase is measured or whether
the phase is displayed in the mathematically correct sense.
C
ONTINUOUS MEASUREMENT (LIVE MODE): see section X on page 4-15.
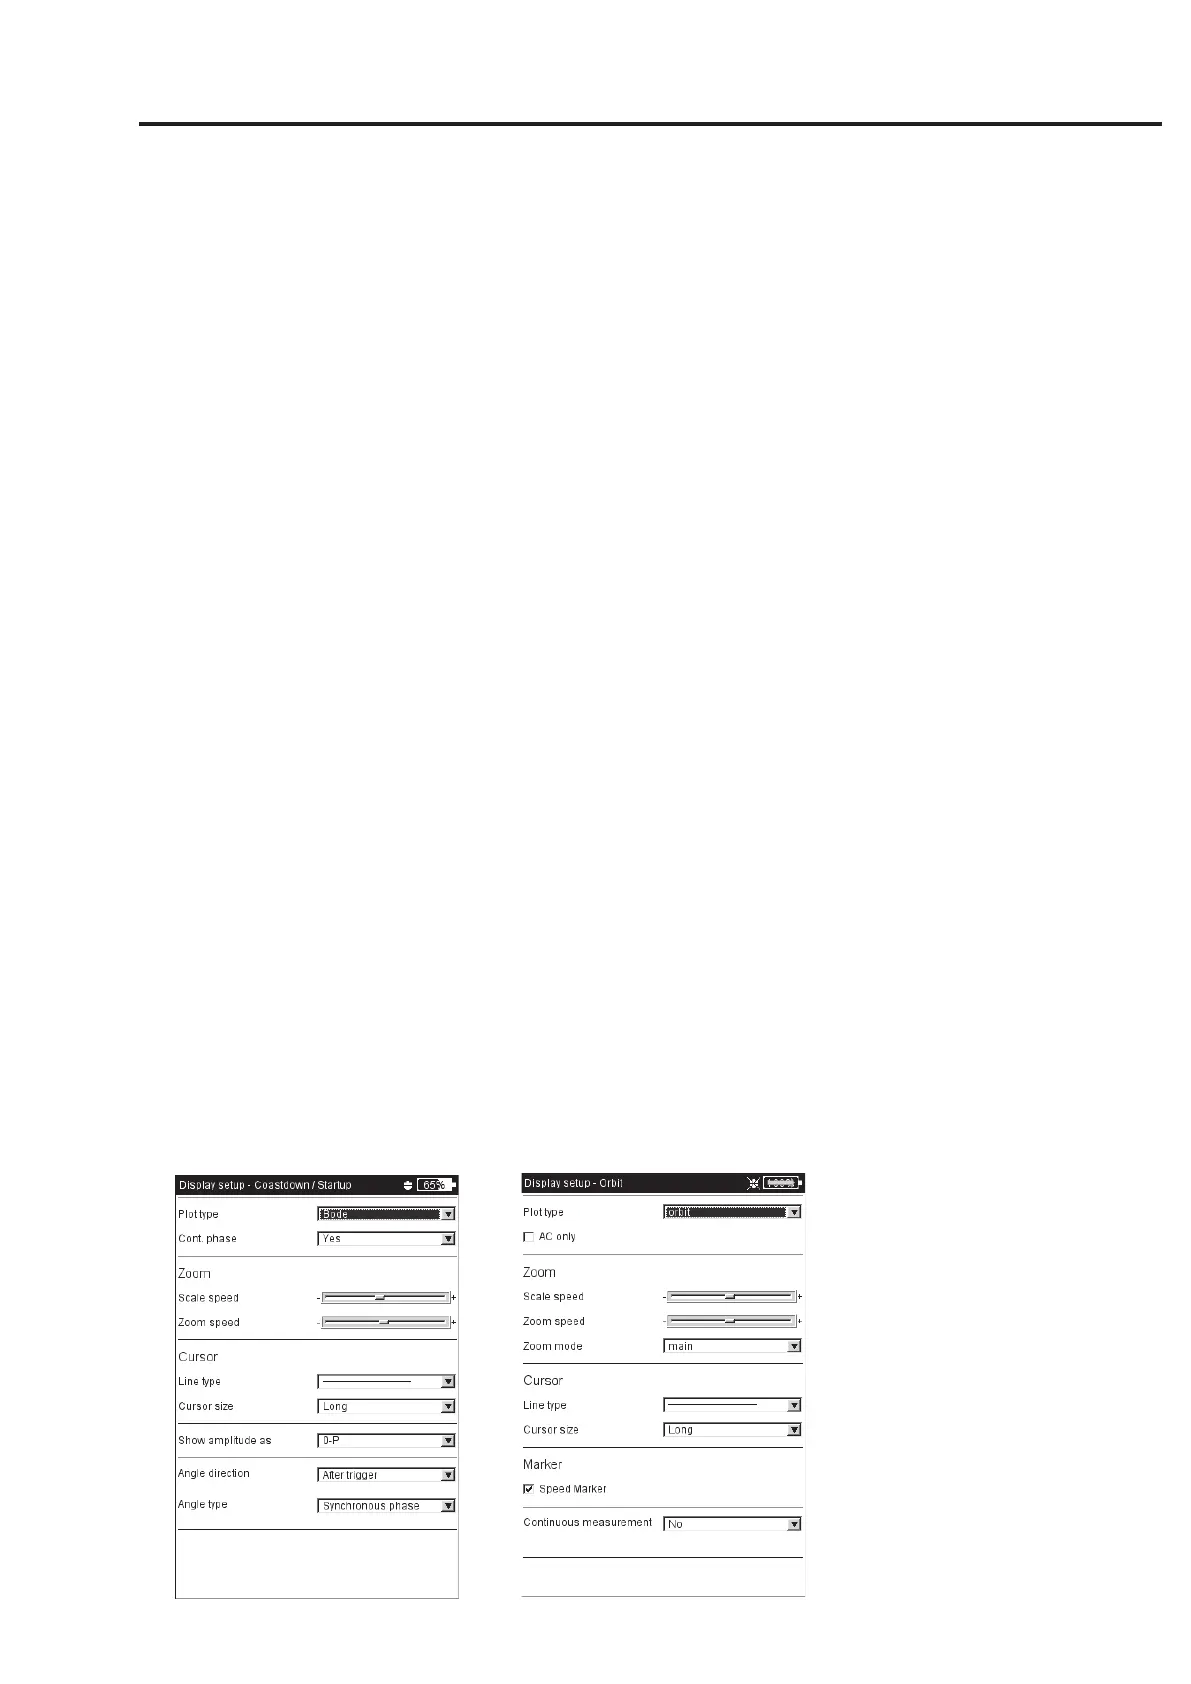
Left:
Display setup for Coastdown
(Phase-RPM)
Right:
Display setup for shaft vibration
(Orbit)
 Loading...