4-18
VIBXPERT 11.2010
Display setup
C2. Display setup for trend: phase
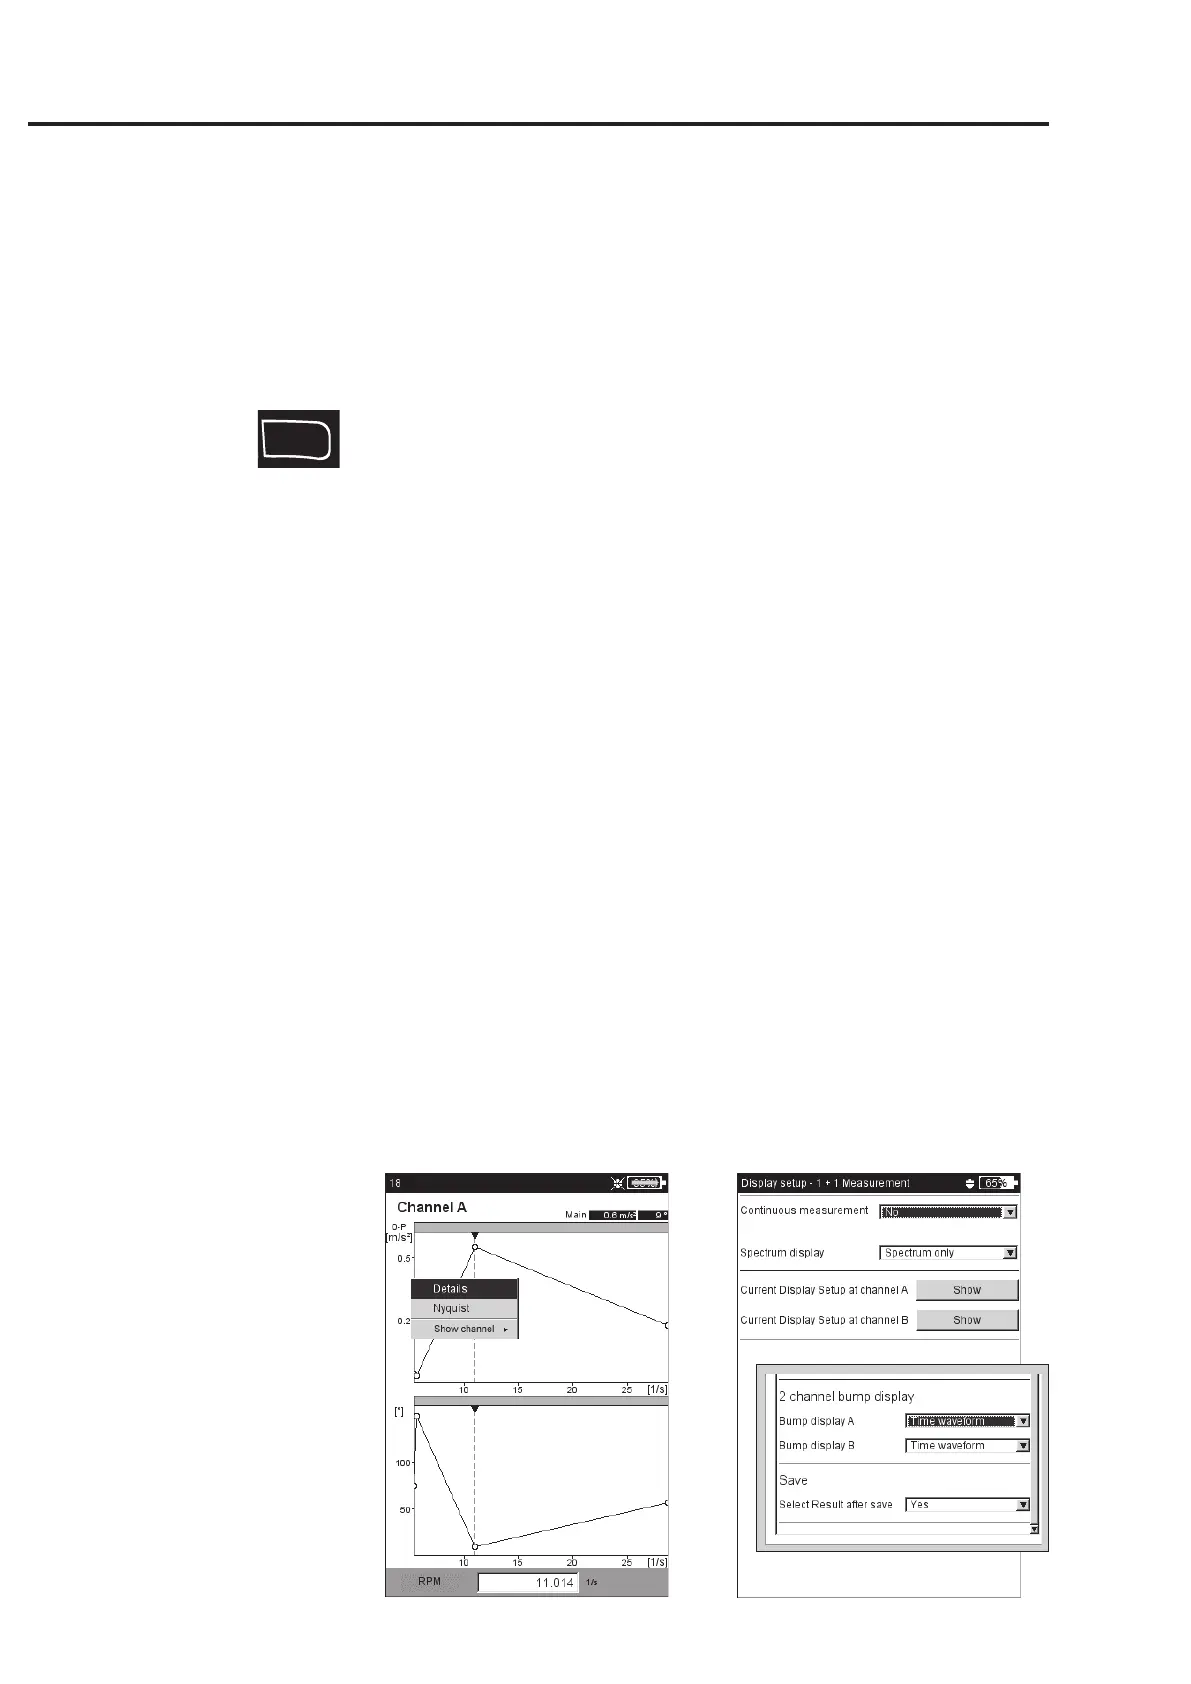
PHASE OVER...: When several phase measurements are saved in one file,
the phase vectors can be shown depending on the time or rpm (see
below).
Phase trend diagram
Use the F-key to open a menu in the results screen (see below) with
the following options:
D
ETAILS: Show result of a single measurement
N
YQUIST / BODE: Change diagram type
S
HOW CHANNEL: Show channel A, channel B or both channels.
D. Display setup for measurement: 2-channel measurement (1+1)
SPECTRUM DISPLAY: If the measurement task contains a spectrum mea-
surement, you can choose whether only the spectrum, or also the
set additional infos (max. 10, time waveform,.. see section B1)
should be displayed.
D
ISPLAY SETUP CHANNEL A / B: Click on Show to display the display
settings of the individual measurement tasks.
To edit the display settings of the individual measurement tasks,
enable the required window section in the measurement screen
and call up the display setup via the MENU key (see diagram on
page 5-24).
E. Display setup for measurement: impact test
BUMP DISPLAY: Choose whether the result of the impact test should be
displayed as a time waveform or spectrum.
S
ELECT RESULT AFTER SAVE: The result selection dialog window opens
automatically (yes) after a measurement is stored.
F
Left:
Phase trend
Phase vector as a function
of the rpm (see figure) or the time
Right:
2-channel display setup for
1+1 measurement
Impact test
 Loading...