RADWIN5000ConfigurationGuide Release4.9.17 12‐7
RunningSpectrumViewfromaHSU SpectrumView
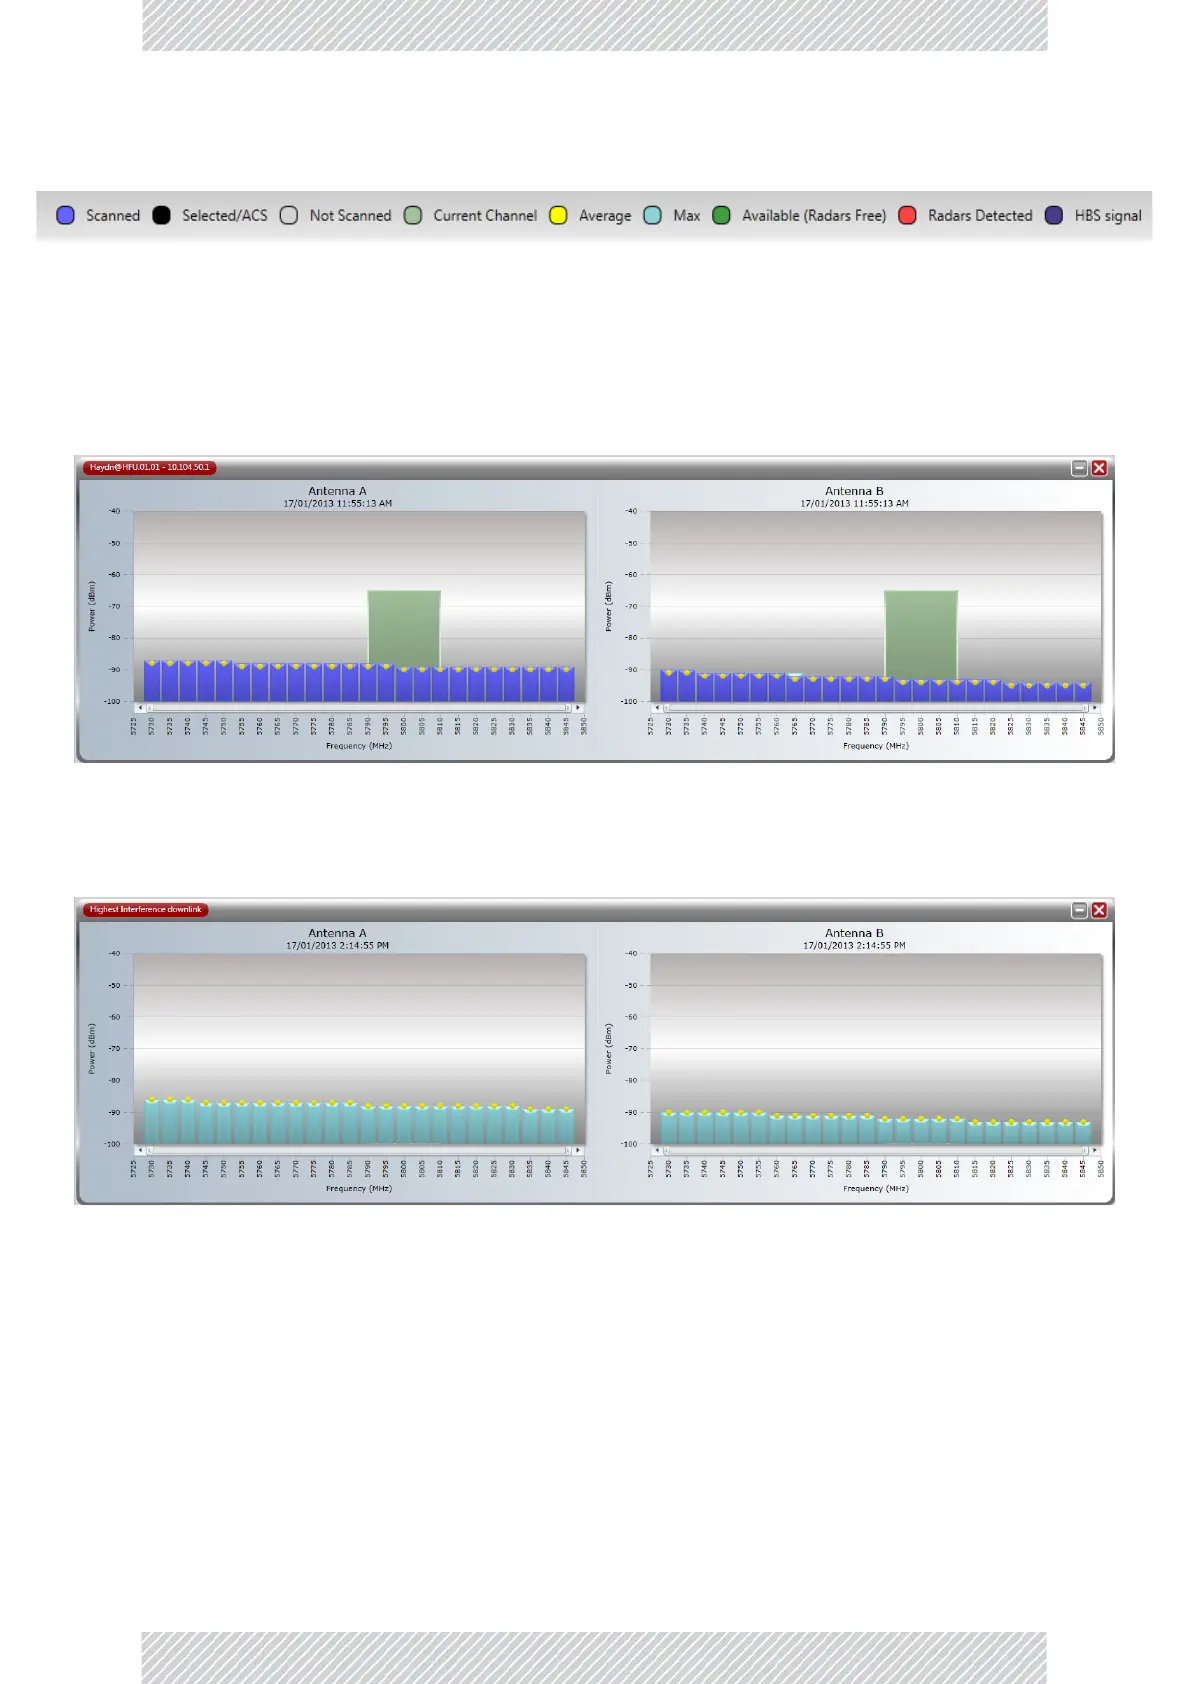
Thek eystothecolorcodingispermanentlydisplayedatthebottomofthemainwindow:
Figure12‐2:SpectrumViewAnalysiscolorcodes
ThegreenbandreflectsthecurrentHBSoperatingfrequency.Noticealsothesmallfly‐over
disketteicon(circled)totheupperleftofeithergraph.ClickingitopensaWindowsFile‐Save
dialogallowingyoutosavethegraphtodiskasajpgfile.
HereistheanalysisforoneoftheHSUs.Itisabitdifferent:
Thelightgreenrectangleinthebackgroundofbothantennadisplaysreflectsactualchannel
(20MHzwidehere)beingusedbytheHSU.ThetitlebaralsocontainstheHSUsIPaddress.
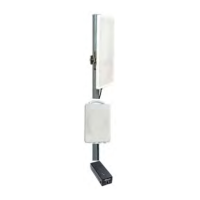
Thereisafurtherdisplayofinterest: HighestInterferenceforallHSUsinthesector:
SeeFigure 12‐2forthecolorcoding.
12.9RunningSpectrumViewfromaHSU
ThereisnodifferenceinprinciplebetweenrunningaSpectrumViewanalysisforaHSUand
runningitforaHBS.ThereisamajordifferencebetweenrunningSpectrumViewonanactive
HSU(registeredornot)orintotalisolationfromthesector.Hereiswhathappensintotal
isolation: