31
4. Basic Operations
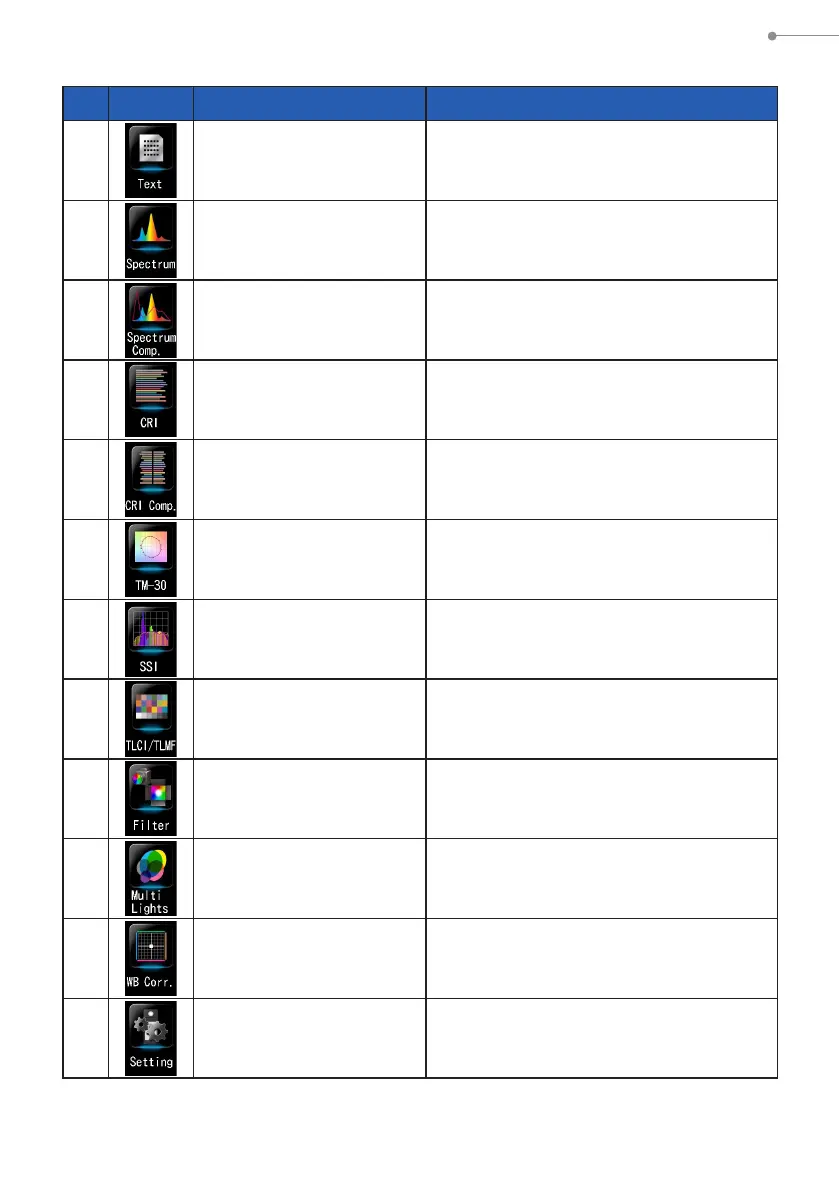
Display Mode Icons List
No. Icon Display Mode Name
Description
1
[Text] Icon
Displays user-selected 5 items in numeric
values. (
P34)
2
[Spectrum] Icon
Displays 3 user-selected values and spectrum
distribution graph. (
P37)
3
[Spectrum Comparison]
Icon
Compares the current measurement value
and up to 2 memorized values in the spectrum
distribution graph. (
P39)
4
[CRI] Icon
Displays the average CRI (Ra) or individual
CRI (R1 ~ R15) numerically. Each CRI is
displayed in a graph. (
P43)
5
[CRI Comparison] Icon
Compares the current measurement value and
memoried value to show the color temperature
and average CRI (Ra). Also, individual CRI (R1
to R15) is displayed in a graph. (
P45)
6
[TM-30] Icon
Displays three current measurement values
(selectable) and color vector graphic.
(
P49)
7
[SSI] Icon
Compares the current measurement value and
up to 2 reference values (color temperature
and
⊿
uv), and displays SSI index with the
SSI spectrum graph. (
P51)
8
[TLCI/TLMF] Icon
Displays the current measurement values and
memorized values (in color temperature and
⊿
uv), TLCI and TLMF with spectrum graph.
(
P62)
9
[Filter] Icon
Displays correction values and camera lter
names or lighting lter names required to
adjust measured light source to target color
temperature. (
P66)
10
[Multi Lights] Icon
Displays and compares up to four
measurement values on the same screen,
Displays the correction value from the selected
measurement value. (
P74)
11
[White Balance Correction]
Icon
Displays correction values in LB index and CC
index between the current measurement value
and the target color temperature in a white
balance graph. (
P80)
12
[Setting] Icon
Displays Setting screen. (
P82)
* 1 ~ 11 are the Measuring screen.
 Loading...