The detailed graph window displays up to 4 days of history.
Trending
Clicking the
Trending last 60m
button will present at-a glance trending graphs for each parameter for
the last 60 minutes.
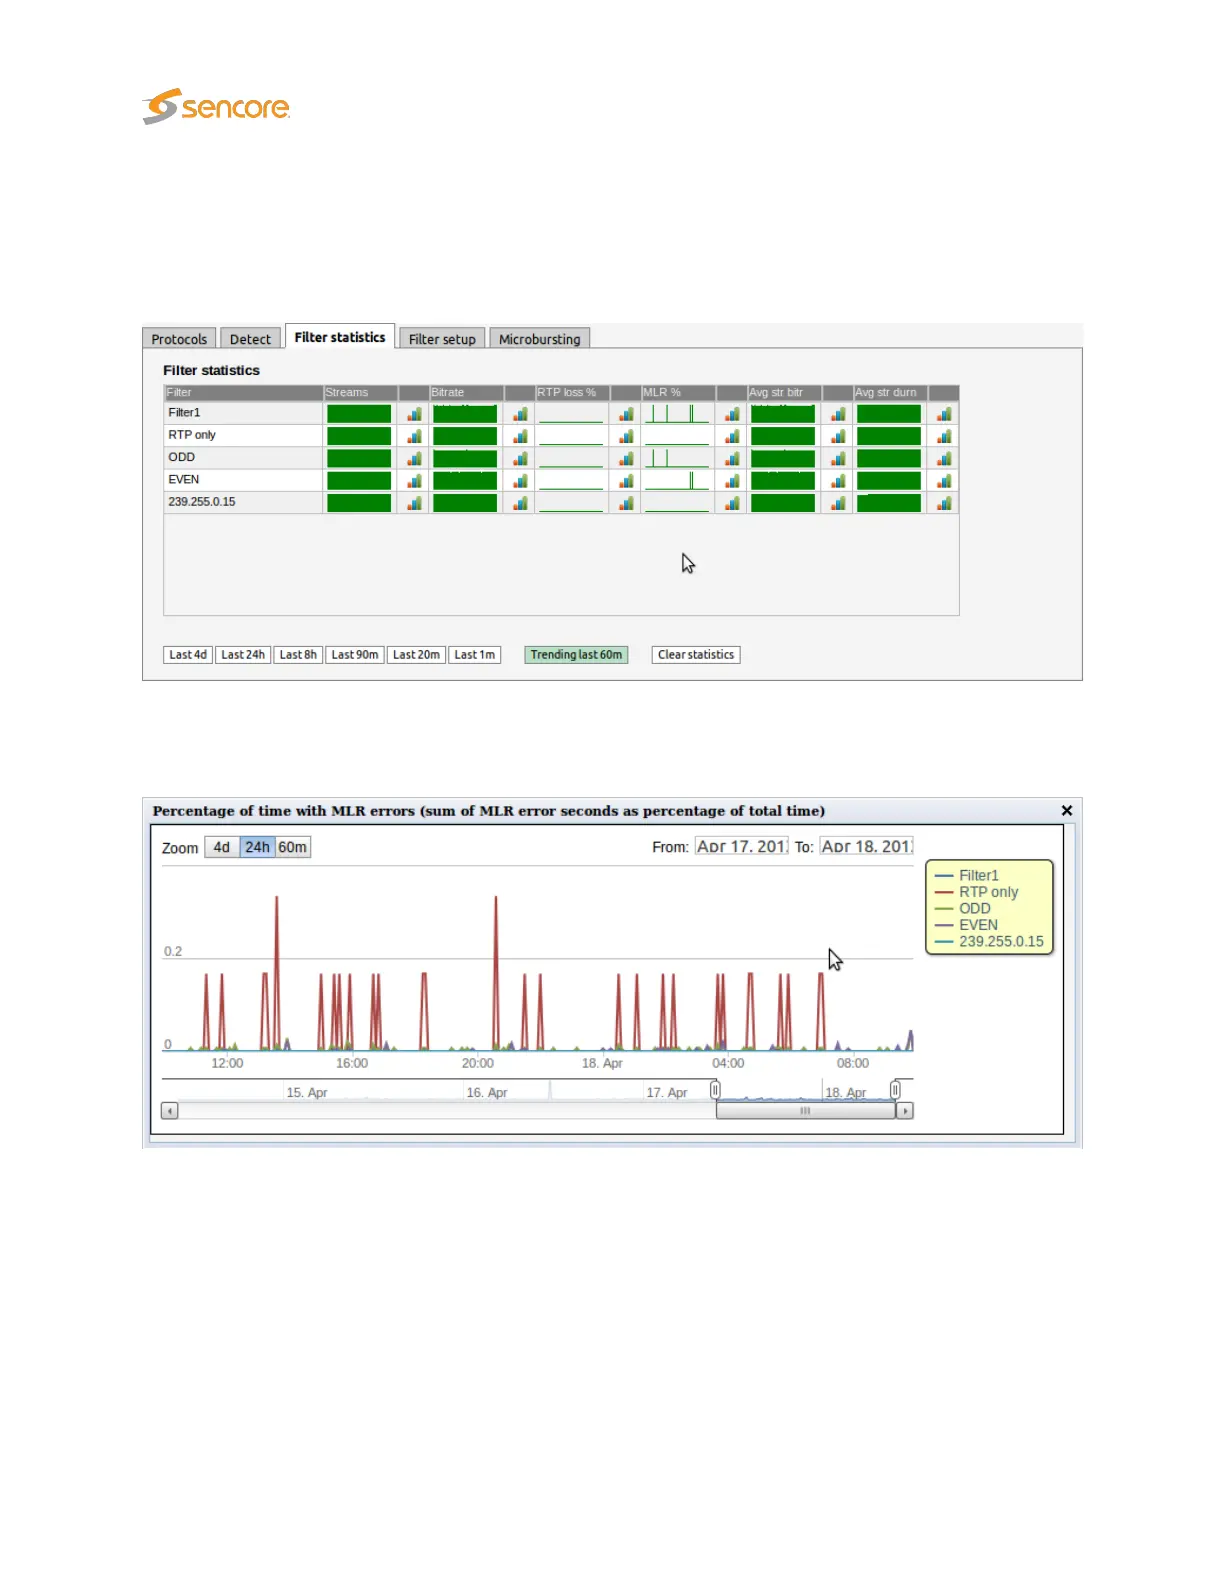
Clicking a graph icon displays the corresponding detailed graph for the selected filter. Clicking the trend
graphs itself will bring up the same detailed graph but will plot all the filters so that they can easily be
compared.
The detailed trending graph above displays MLR errors for all filters.
114 VB2xx GigE User’s Manual version 5.4