If a service is selected for comparison this subview simply shows the selected service and any active
alarms affecting the service.
Services
If a transport stream is selected for comparison the
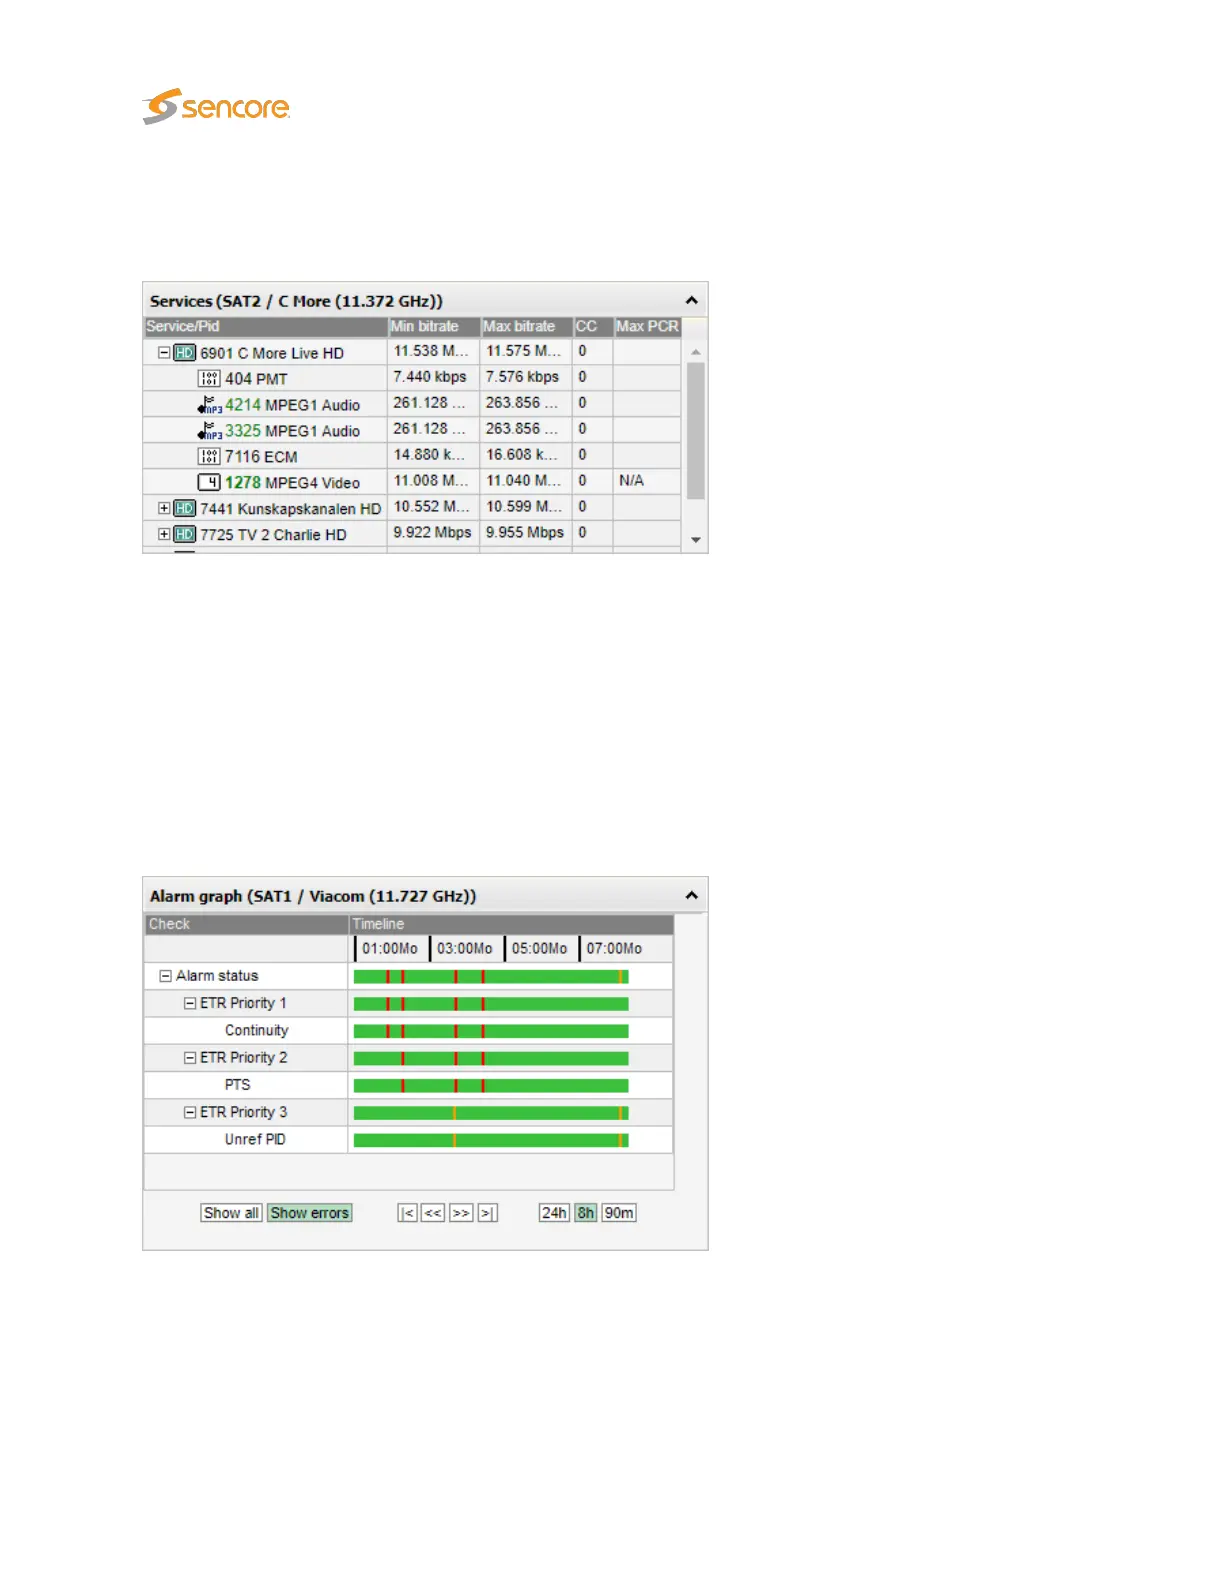
Services
subview displays a list of services present
in the stream. Clicking the plus icon at a service will expand the service tree, displaying the service’s
individual components. The minimum and maximum effective bitrates of a service/component are also
shown, in addition to the number of continuity counter errors and the maximum measured PCR jitter (if
relevant).
Colored PIDs indicate scrambling; blue and green representing odd and even scrambling respectively.
Note that all references to a PID will result in a PID entry, i.e. one PID may be displayed several times in
the list.
Alarm graph
The Alarm graph subview shows similar alarm graphs as the
ETR 290 — ETR Details — Alarm
graph popup
view. Please refer to the
ETR 290 — ETR Details
section of this user’s manual for a
comprehensive description of this view.
ETR Details
150 VB2xx GigE User’s Manual version 5.4