Directly beneath this list, the current parameters for the selected stream are displayed, as in the
Joined
multicasts list.
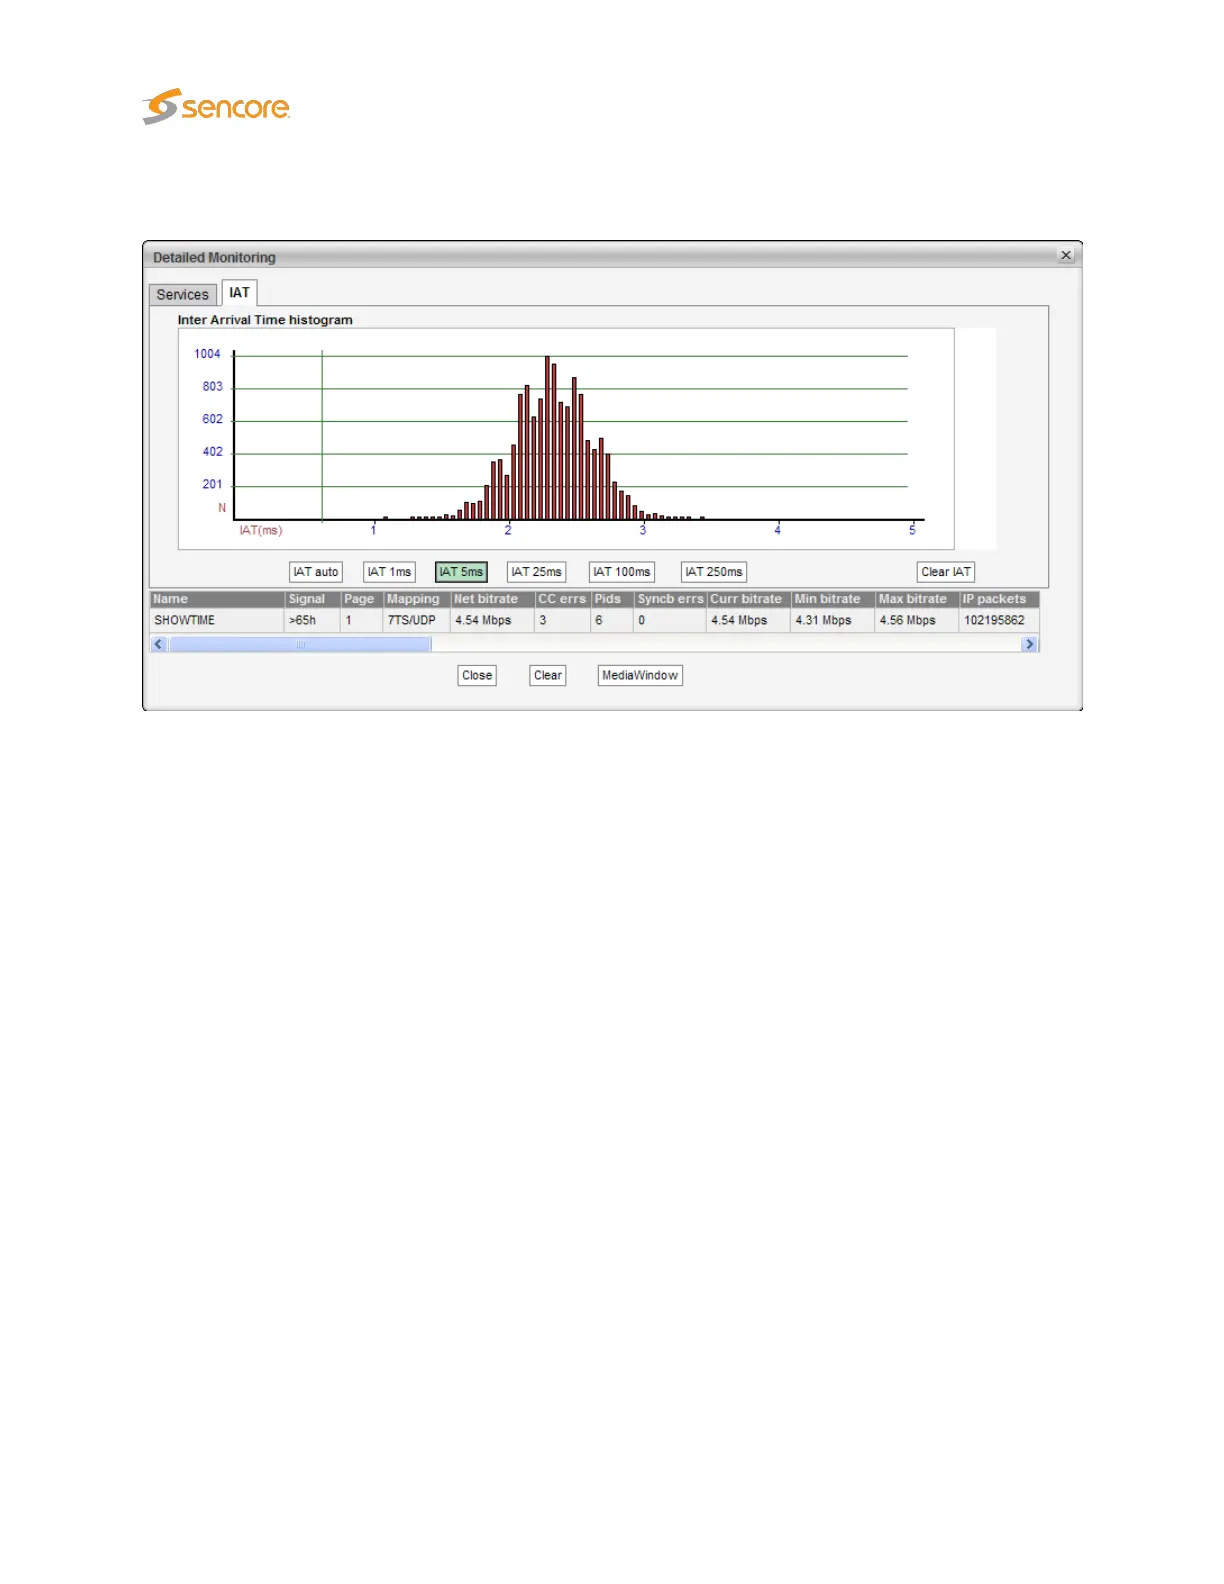
In the
Detailed Monitoring — IAT
view the
Inter Arrival Time
histogram shows the accumulated number
of IAT measurements within each presented interval. Vertical green lines indicate the maximum and
minimum IAT values. By clicking the IAT range buttons it is possible to change the zooming of the graph. If
the
IAT auto
button is pressed the diagram will auto-scale to always include the minimum and maximum
IAT readings.
The IAT histogram is a very useful and intuitive measure of how well the network is performing in terms
of forwarding real-time traffic. A predictable and tightly bunched graph indicates small levels of network
jitter. An unbound graph indicates network jitter issues typically brought forward by traffic congestion or
misconfigured routers. Clicking the Clear IAT button will clear the IAT graph.
Under the IAT histogram the
Multicasts — Parameters (Current parameters)
measurements for the
selected stream are displayed. Clicking the
Clear
button will clear all information about the selected
stream, including PSI/SI analysis data.
Clicking the
MediaWindow
button will open the Media Window
Selected channel
view. This is described
in section 6.5.
Note that for variable bitrate streams the IAT histogram will show a very different IAT distribution compared
to the histogram for a constant bitrate stream. The histogram in the screenshot above displays the IAT
distribution for a CBR stream.
86 VB2xx GigE User’s Manual version 5.4