Questions? Call or Text +1-801-658-0015 • 13
Chapter 4: Home Screen Operation
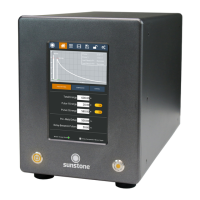
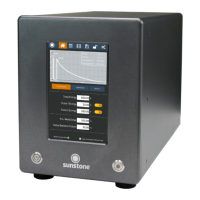
The Home Screen is where the operator controls all aspects relating to the weld energy, waveform, and timing
delays. During operation, the Home Screen will be accessed more than any other screen.
Waveform Display
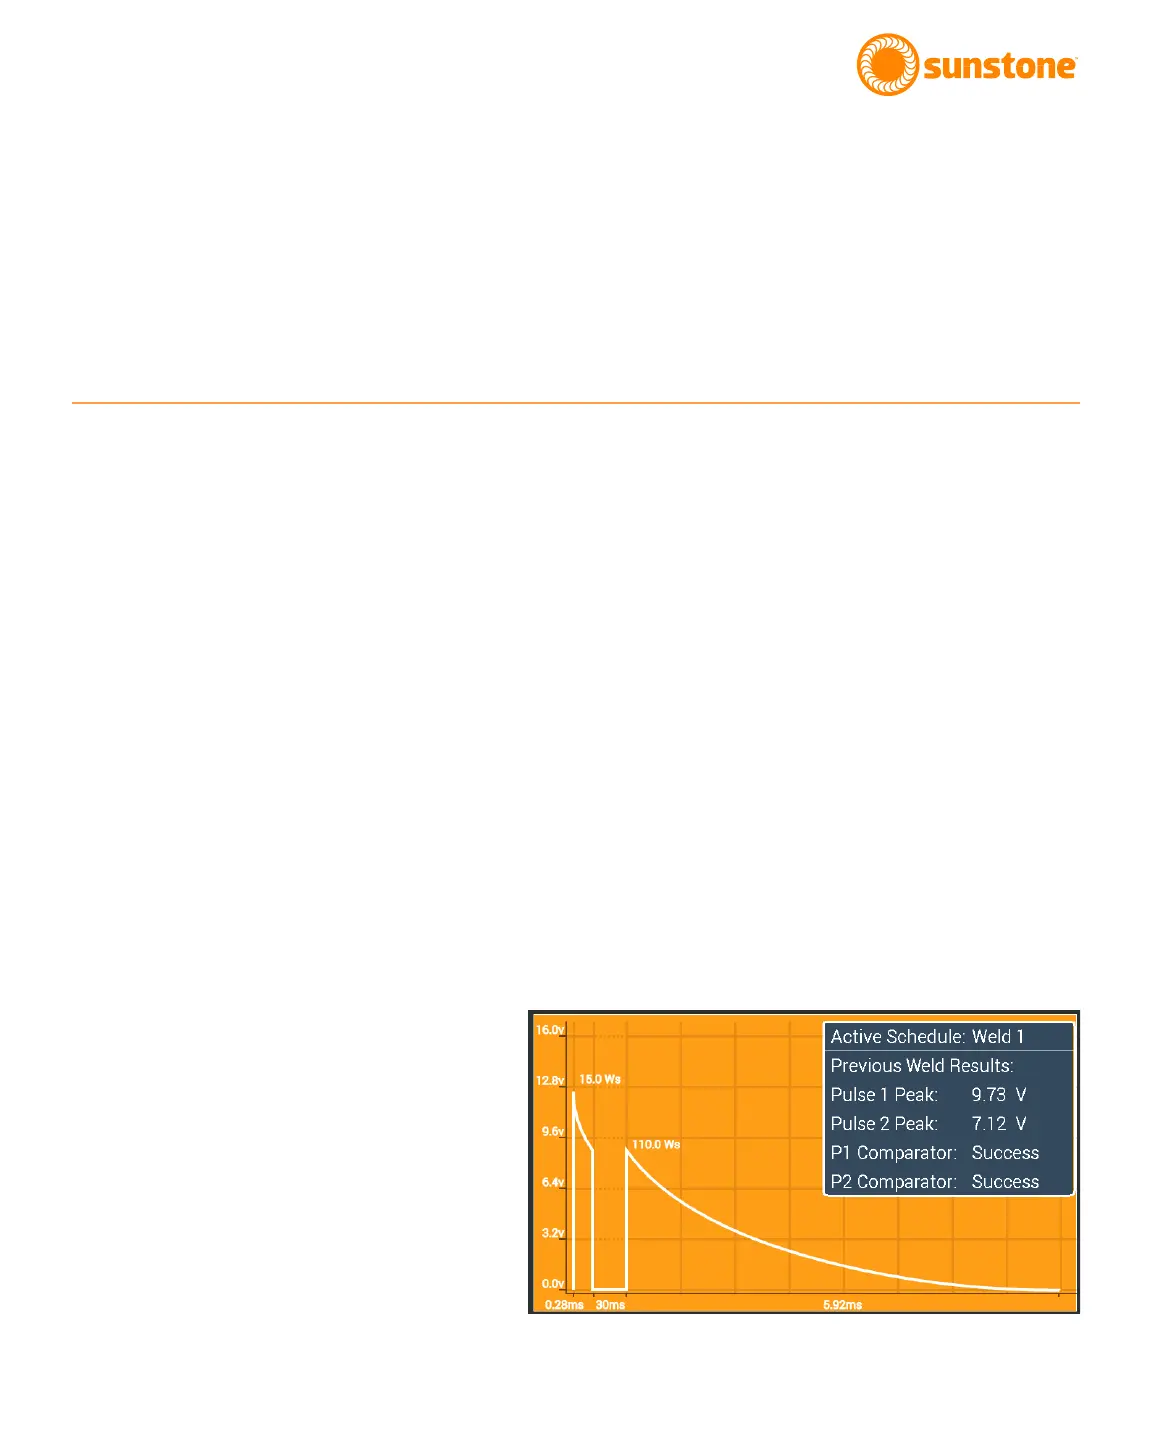
The Waveform displays a graphical representation of the settings determined for each weld parameters. See
Figure 13.1. Weld Voltage is displayed on the y-axis, and pulse width (time) is displayed on the x-axis. The total
energy per pulse, as displayed in the blue Info Box within the Waveform, is calculated based on the voltage and
time, and is displayed next to the waveform peaks. Total energy is measured in watt-seconds (Ws).
The blue Info Box in the upper right corner of the waveform display shows the saved name of the Active Sched-
ule (if the settings were previously saved to the welder. Also, the Info Box shows the comparator results from
the previous weld (if the comparator is enabled. See page 16 for additional detail about the comparator).
If the Comparator Tab is selected, green lines will appear in the Waveform to indicate the lower limit of the com-
parator values. Red lines will indicate the upper limit of the comparator values. See page 16 to learn more about
the Comparator.
Note: the waveform background color is orange when the Weld On/O button is turned on and gray when the
Weld On/O button is turned o.
Figure 13.1.The Waveform displays a
graphical representation of the weld
settings. Voltage is displayed on the
y-axis. Time is displayed on the x-axis.