Questions? Call or Text +1-801-658-0015 • 17
If Pulse 1 is found to be outside of the limits, operators can
choose to continue to Pulse 2, or stop the weld and inhibit pulse
2. To do so, toggle the “Continue on Failure” button.
The results section near the bottom of the screen shows the
results of past welds. The number of Good welds is listed rst,
both as a hard count as well as a percentage of total welds.
Next is the counter for Pulse 1 fails, then Pulse 2 fails, then Part
Check Fails, and nally the total count of all welds is on the far
right. The horizontal color bar underneath indicates the total
Good welds (Green) and Bad welds (Red).
Welder Charge State
The Welder Charge State is an indicator at the very bottom of
the screen, as shown in Figure 16.1 and 17.1. This indicator will
display one of three colors:
• Green indicates that the welder is ready to weld.
• Black indicates that the welder is not ready to weld, or
the Weld On/O button is o.
• Red indicates that the E-Stop is engaged.
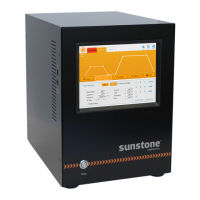
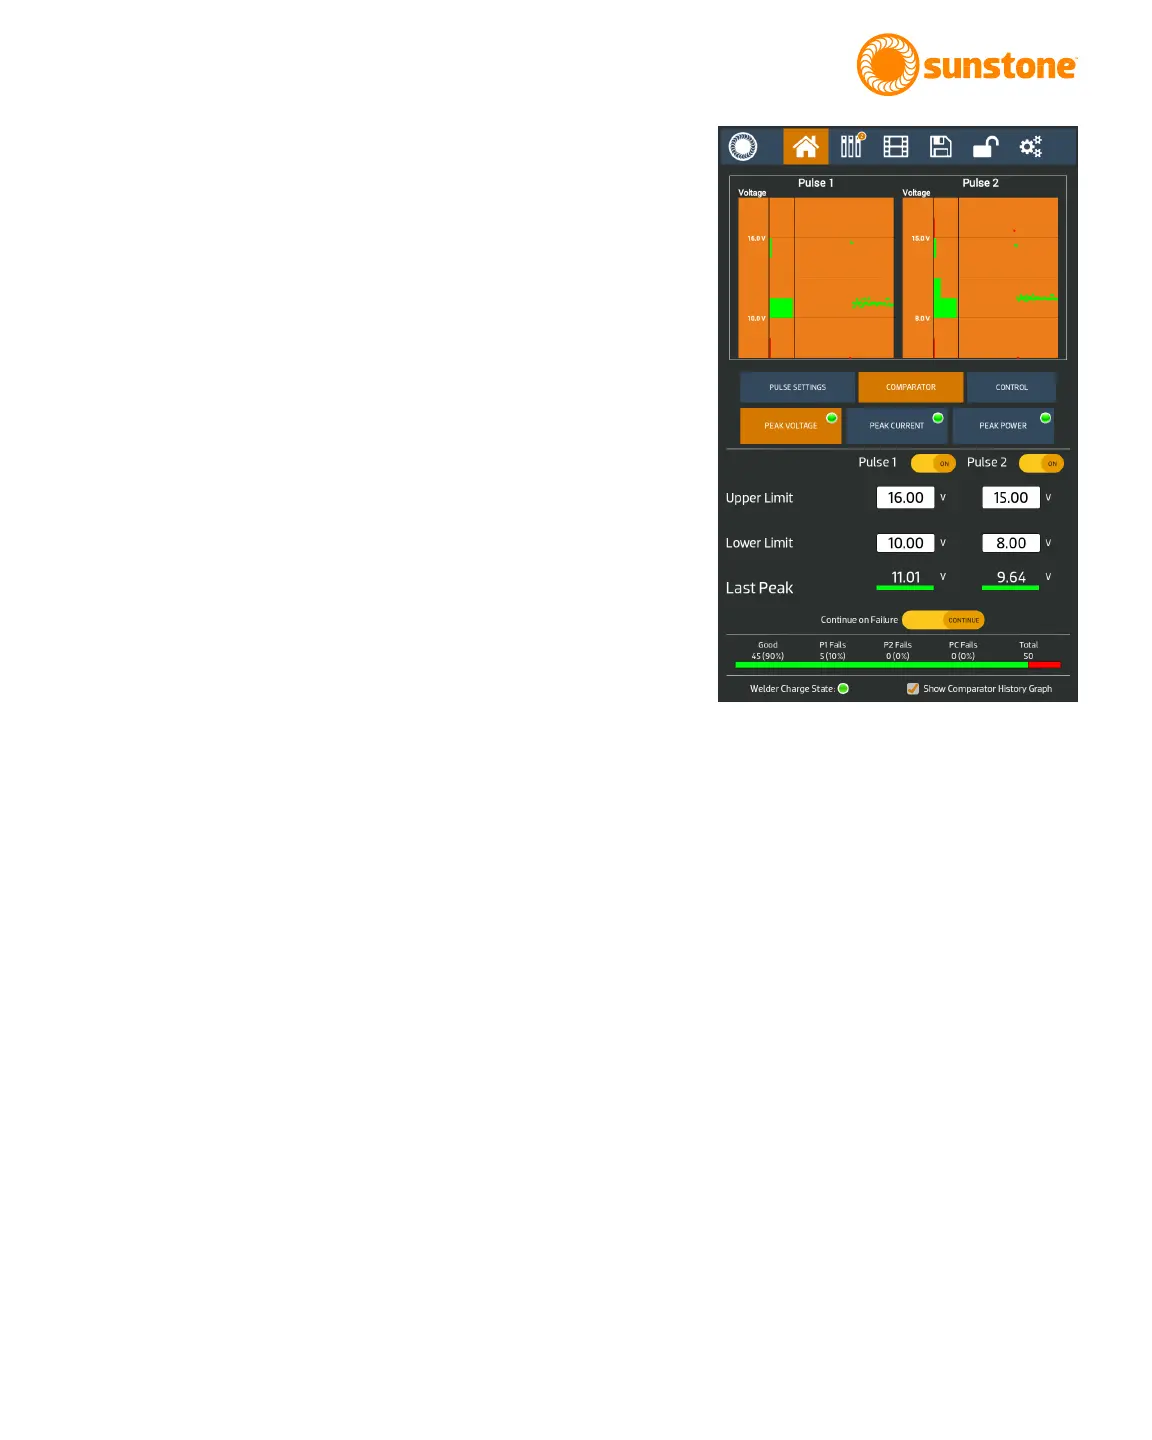
Show Comparator History Graph
The check box for the Show Comparator History Graph is on
the bottom right of the screen. Checking this box will replace
the Waveform with a histogram plot. See Figure 17.1. The
histogram plot will show the monitored peak value for the
previous welds. The histogram will plot the individual values, as
well as aggregate them on the left side of the plots. The upper
and lower limits are indicated with the horizontal lines, and the
median value between the upper and lower values is also drawn
halfway between the limits. Values that fall within the limits will
be plotted with a green dot. Values outside of the limits will
be plotted with a red dot. The histogram will show one or both
pulses depending on which ones are enabled.
NOTE: The waveform display data and the histogram display
data will change based on which tab is selected (Peak Voltage,
Peak Current, and Peak Power). It is possible to have a weld
that is within limits on the one tab (i.e. Peak Voltage), but not
another (i.e. Peak Current).
Figure 17.1. Histogram of previous welds.