Use the default dBV scale to see a detailed view of multiple frequencies, even if they have very different amplitudes. Use the linear scale to
see an overall view of how all frequencies compare to each other
.
The math FFT feature provides a selection of windows. Each offers a trade-off between frequency resolution and magnitude accuracy. The
choice of which window to use depends upon what you want to measure and your source’s signal characteristics.
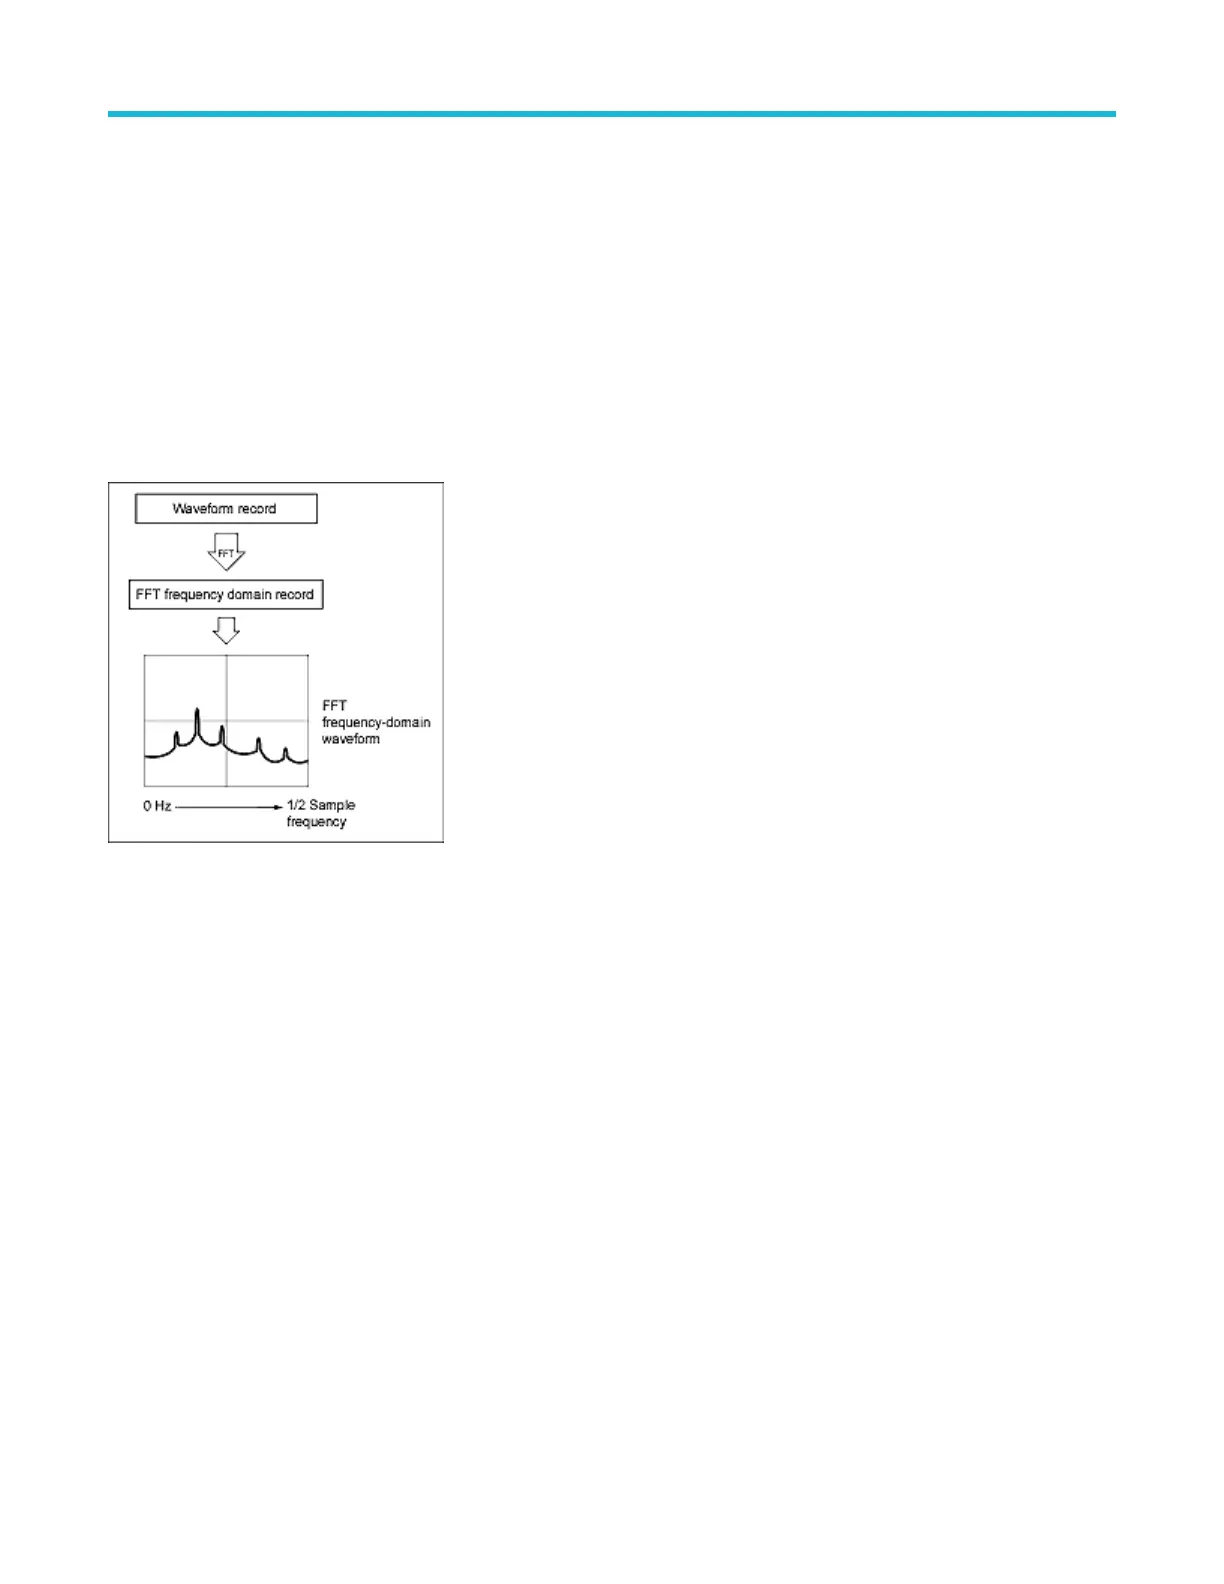
FFT process
An FFT waveform displays a frequency-domain view, up to the Nyquist frequency, of a time-domain signal.
The FFT process mathematically converts the standard time-domain signal (repetitive or single-shot acquisition) into its frequency
components.
The FFT function processes the waveform record and displays the FFT frequency domain record, which contains the input signal
frequency components from DC (0 Hz) to ½ the sample rate (also called the Nyquist frequency).
FFT and aliasing
Aliasing occurs when the input frequency of a signal is greater than one half of the sampling frequency (the sample rate).
Set the sample rate high enough so that the signals in the spectrum appear at their correct frequency as opposed to a lower aliased
frequency value. Also, complex signal shapes that have many harmonics in them, such as a triangle or square wave, can appear to be OK
in the time domain when in fact many of the harmonics in that signal are aliased.
One way to check for aliasing is to increase the sample rate and observe whether any of the harmonics unwrap to dif
ferent frequency
locations.
Another way to recognize aliasing is to realize that higher order harmonics usually have decreasing magnitudes compared to lower order
harmonics. Thus, if you see a series of increasing harmonic magnitude values as frequency increases then you can suspect that they
may be aliased. In the spectral math waveform, the actual higher frequency components are under sampled, and therefore they appear
as lower frequency aliases that fold back around the Nyquist point. You may test by increasing the sample rate and observing if aliases
unwrap to different frequency positions.
Measurement concepts
3 Series Mixed Domain Oscilloscope Printable Help 267