Creating and Using Math Waveforms
TDS5000 Series User Manual
3- 173
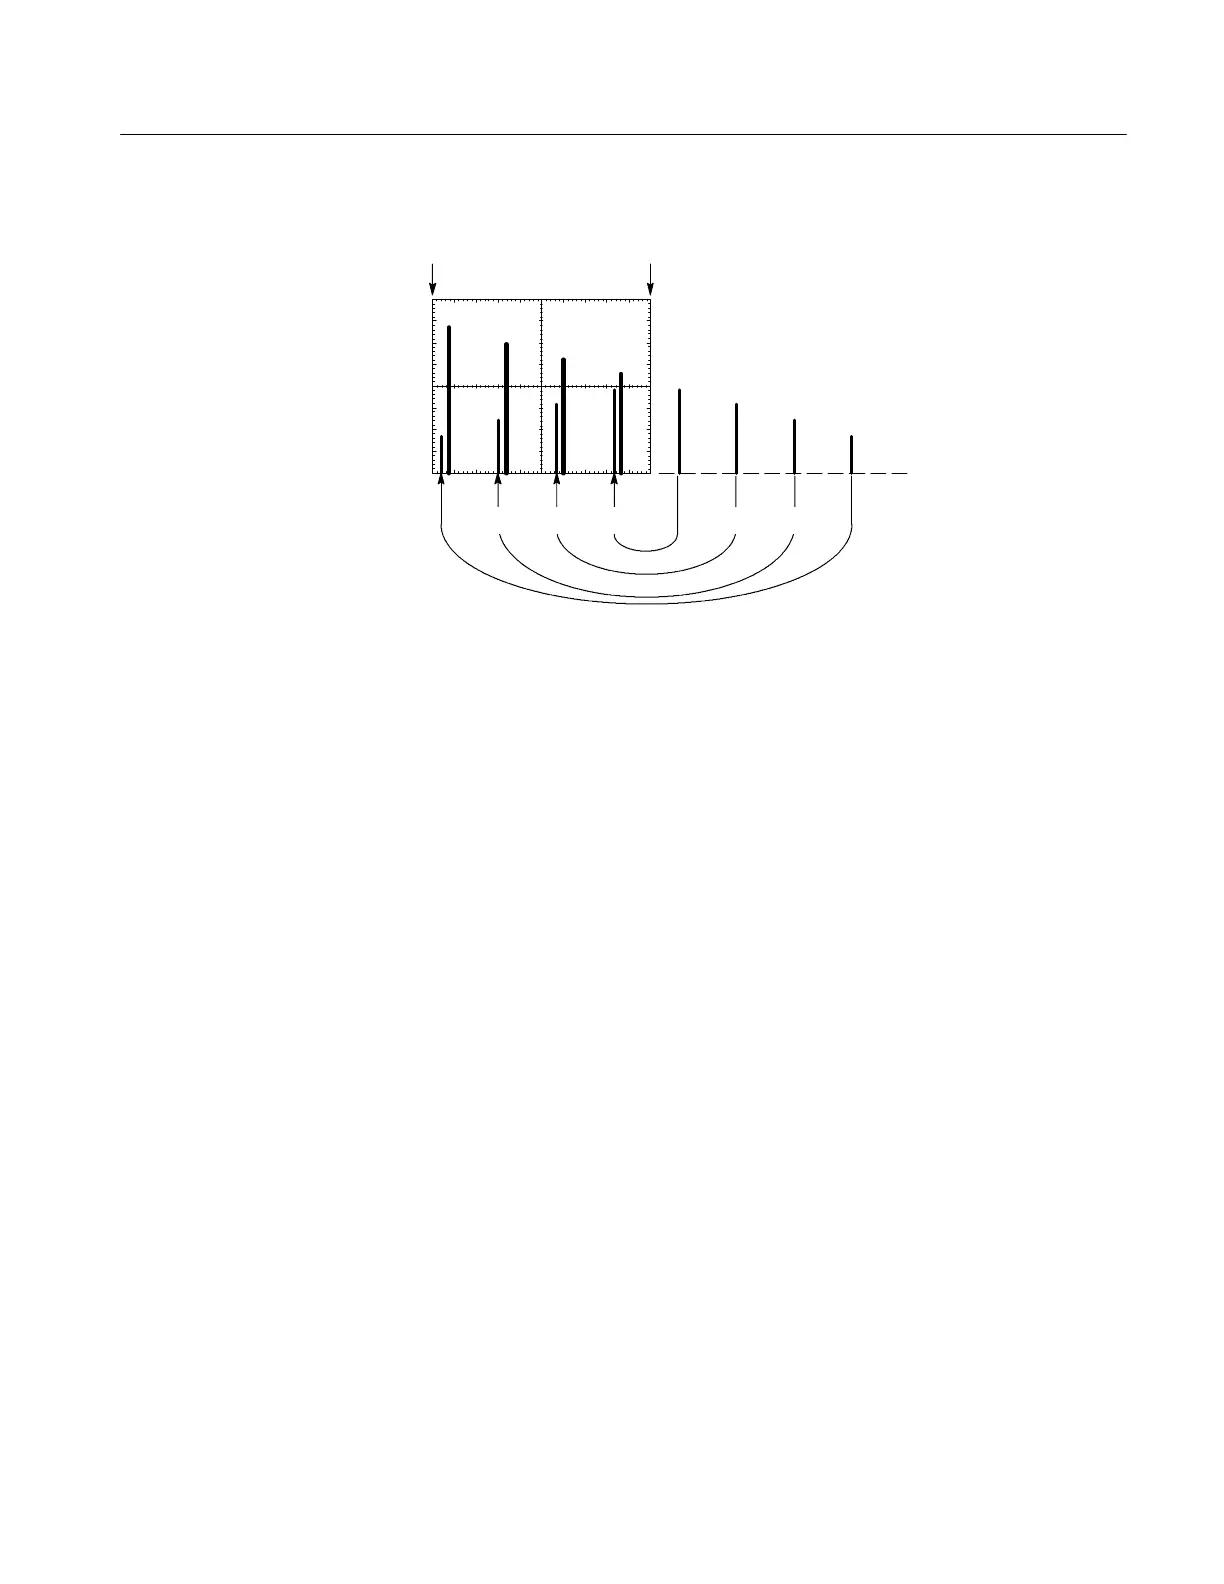
Frequency
Amplitude
Aliased frequencies Actual frequencies
0Hz
Nyquist frequency
(½ sample rate)
Figure 3- 58: How aliased frequencies appear in a spectral waveform
If you have a variable-frequency signal source, another way to observe aliasing is
to adjust the frequency slowly while watching the spectral display. If some of the
harmonics are aliased, you will see the harmonics decreasing in frequency when
they should be increasing or vice versa.
To Take Cur sor Measurem ents of a Spectral Math Waveform. Once you have
displayed a spectral math waveform, use cursors to measure its frequency
amplitude or phase angle. Use the procedure found in Taking Cursor Measure-
ments on page 3--124.
To Take Aut omated Measurements of a Spectral Math Waveform. You can use
automated measurements to measure spectral math waveforms. Use the
procedure found in Taking Automatic Measurements on page 3--115.
 Loading...