Appendix B: Automatic Measurements Supported
TDS5000 Series User Manual
B-3
Table B- 1: Supported measurements a nd their definitions (Cont.)
Name Definition
Waveform Count Displays t he number of waveforms that have contributed to the histogram.
Peak Hits Displays the number of points in the largest bin of the histogram.
Pk-Pk Displays the peak-to-peak value of the histogram. Vertical histograms display the “voltage” of
the highest nonzero bin minus the “voltage” of the lowest nonzero bin. Horizontal histograms
display the “time” of the rightmost nonzero bin minus the “time” of the leftmost nonzero bin
(Max -- Min).
Max Displays the maxim um voltage or time.
Min Displays the minimum voltage or time.
Mean 1StdDev The percentage of points in the hi stogram which are within 1 standard deviation of t he
histogram mean.
Mean 2StdDev The percentage of points in the hi stogram which are within 2 standard deviations of t he
histogram mean.
Mean 3StdDev The percentage of points in the hi stogram which are within 3 standard deviations of t he
histogram mean.
High (Histogram)
Low (Histogram)
Low (Min/Max)
High (Min/Max)
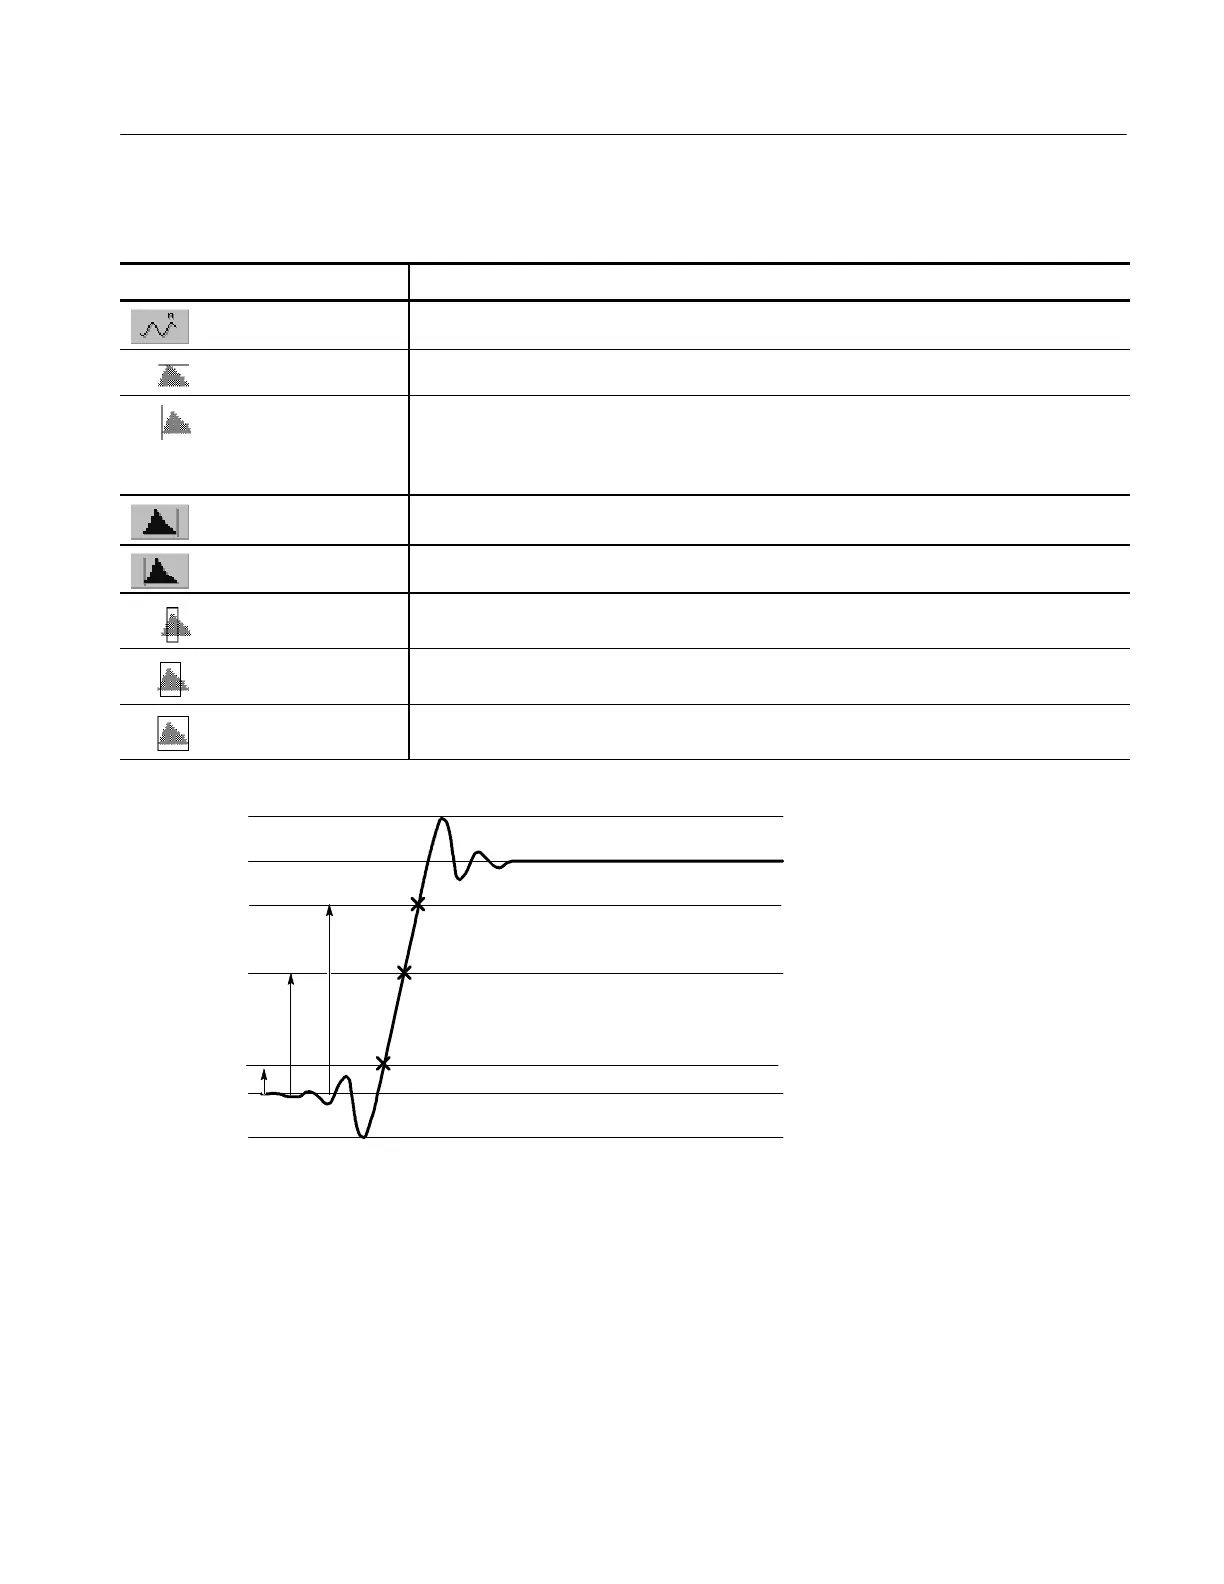
Mid reference
High reference
90%
10%
50%
Low reference
Figure B- 1: Levels used to determine measurements
 Loading...