Operation 4–24
The Term Soft Key will toggle between Function 1 and Function 2 to enable the limits to be set
for the active Function. The active Function is shown in a rectangle (Cp in the figure above).
The Abs/Perc Soft Key toggles the limits between Percentage values relative to a user-selected
nominal value and Absolute values.
The High Limit Soft Key allows the upper limit for the active Function to be entered by the
user. When the first digit has been keyed in, the Soft Keys will change to allow valid units to be
selected (for example µΩ , mΩ, kΩ and MΩ when the active Function is Z).
The Low Limit Soft Key allows the lower limit for the active Function to be entered by the
user.
When the Percentage option has been selected, a fifth Soft Key, Nom, will appear. This allows
the Nominal value, relative to which the percentages are calculated, to be entered.
The measurement conditions should be set up as normal using the Set Pull Down Menu.
Measurements are then triggered as normal using the Trigger key and Sngl/Rep keys.
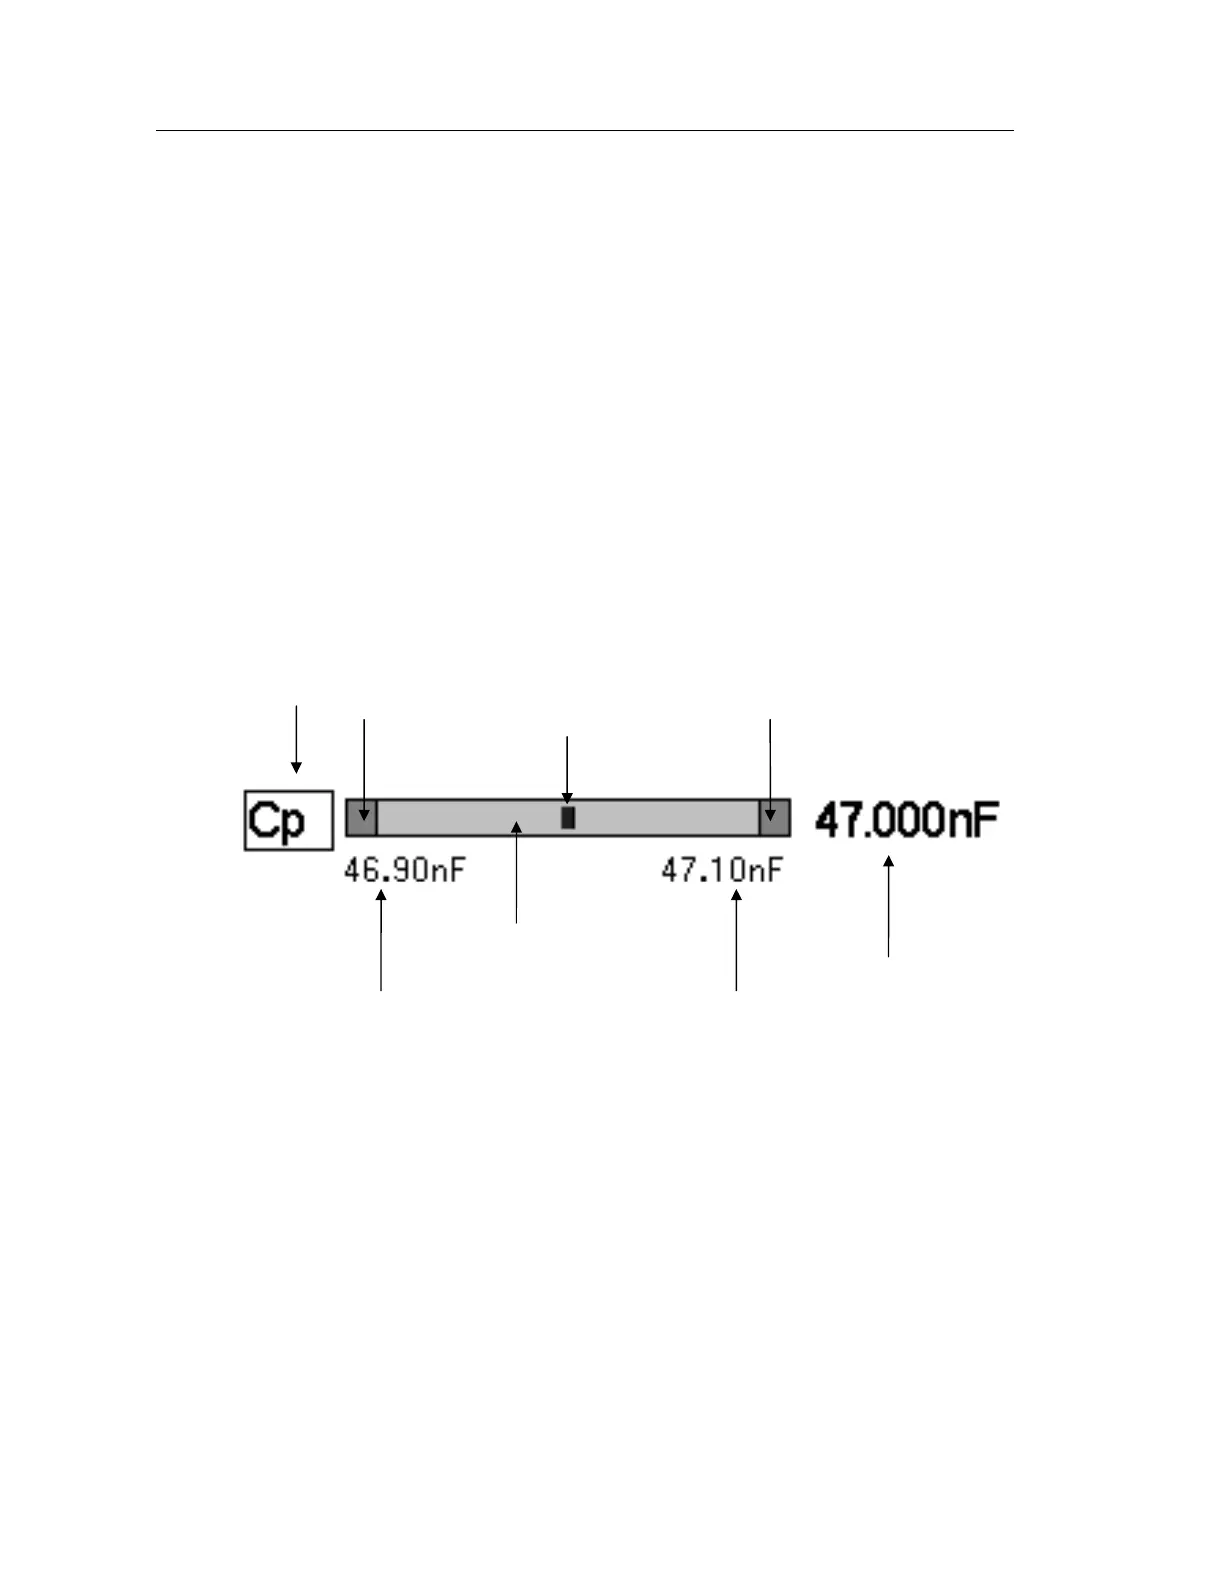
The measurements for Functions 1 & 2 are each plotted on a bar graph. The figure below
explains the bar graphs:
Figure 4-32 Bar Graph explanation
When the measurement is inside the PASS region, bar graph indicator position will be
proportional to the Low and High Limits.
When the measurement is outside the PASS region, the indicator will be in the appropriate
FAIL region and the measurement will be in reversed contrast.
Active Function
PASS region
FAIL below Low Limit FAIL above High Limit
Low Limit High Limit
Measurement
Bar graph indicator