BINNING
6–2
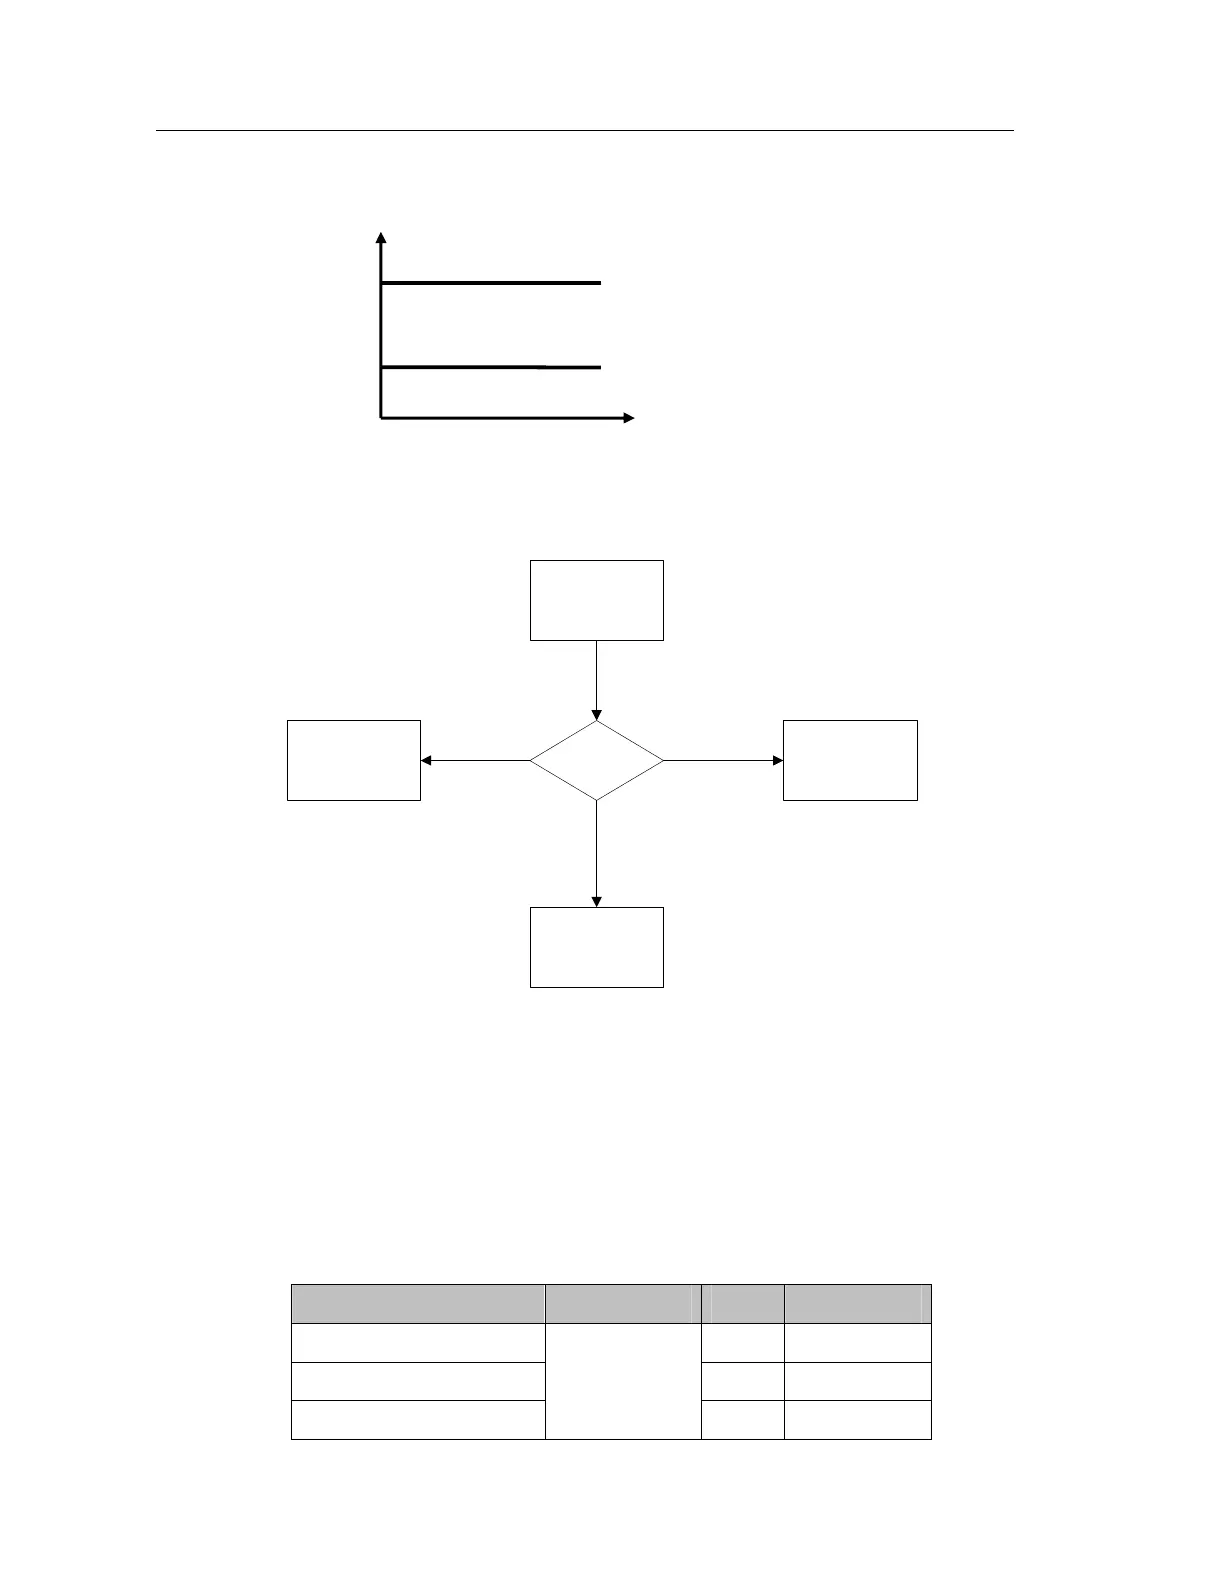
One Term binning can also be illustrated using the following diagram:
Figure 6-2 One Term Bin Type two axis diagram
The following flow chart shows the decision process used to sort the DUT into bins:
ELSE
TERM1 > HL1
TERM1 < LL1
Measurement
complete
TERM1 valueBIN 1 BIN 2
BIN 0
Figure 6-3 One Term Bin Type flow chart
An example of One Term binning:
TERM1 measures Rs TERM2 measures Ls
TERM1 Low Limit (LL1) set to 0.9Ω
TERM1 High Limit (HL1) set to 1.1Ω
TERM1 value TERM2 value BIN PASS/FAIL
<0.9Ω 1 FAIL
Between 0.9Ω and 1.1Ω 0 PASS
>1.1Ω
ANY
2 FAIL
BIN1
BIN2
LL1
HL1
TERM1
TERM2
BIN0