6-27
IM MV1000-01E
Display Configuration
1
2
3
4
5
6
7
8
9
10
11
12
13
App
Index
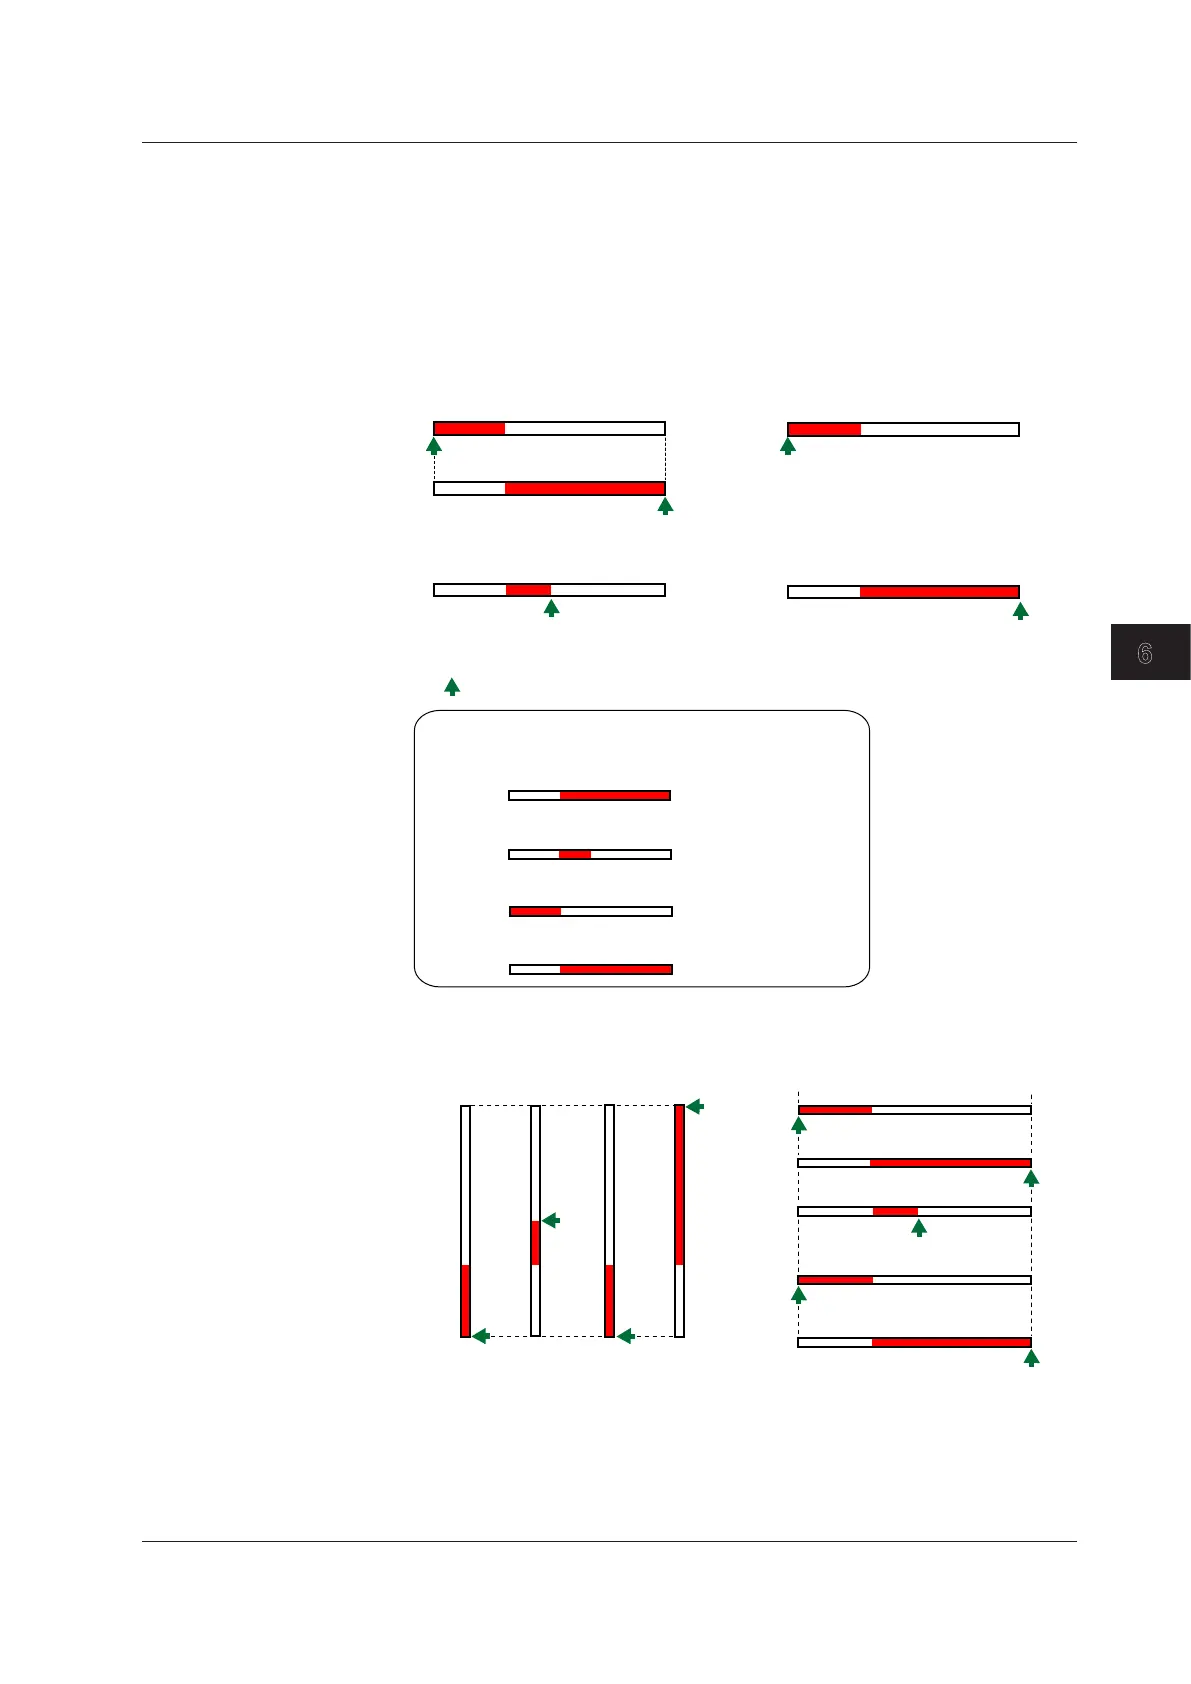
When the Bar Graph Display Direction Is Set to Horizontal
The span lower limit (or scale lower limit) is set to the left edge of the bar graph, and
the span upper limit (or scale upper limit) is set to the right edge of the bar graph.
• Starting point of the bar
Normal: The left edge or right edge, whichever is less
Center:
Center
Lower: Left edge
Upper: Right edge
Center
Normal
Upper
Lower
V
lower
(V
lower
< V
upper
)
(V
lower
> V
upper
)
V
upper
V
lower
V
upper
V
lower
V
upper
V
lower
V
upper
Vupper: Span upper limit (or scale upper limit)
Vlower: Span lower limit (or scale lower limit)
: Starting point of the bar
Center
Normal
Upper
Lower
0.0
–100.0
0.0
–100.0
0.0
–100.0
0.0
–100.0
Example: When the input range’ s span lower limit is 0.0,
and the span upper limit is –100.0
When Displaying a Bar That Indicates the Current Value on the Scale in
the Trend Display
(V
lower
< V
upper
)
Center
Normal
Upper
Lower
V
lower
V
upper
(V
lower
> V
upper
)
Normal
Center
Lower Upper
V
lower
V
upper
• Bar graph > Division
Select the number of main scale marks from 4 to 12.
6.11 Changing the Bar Graph Display Method
 Loading...