6-2 IM 760301-01E
Explanation
For functional details, see section 2.7.
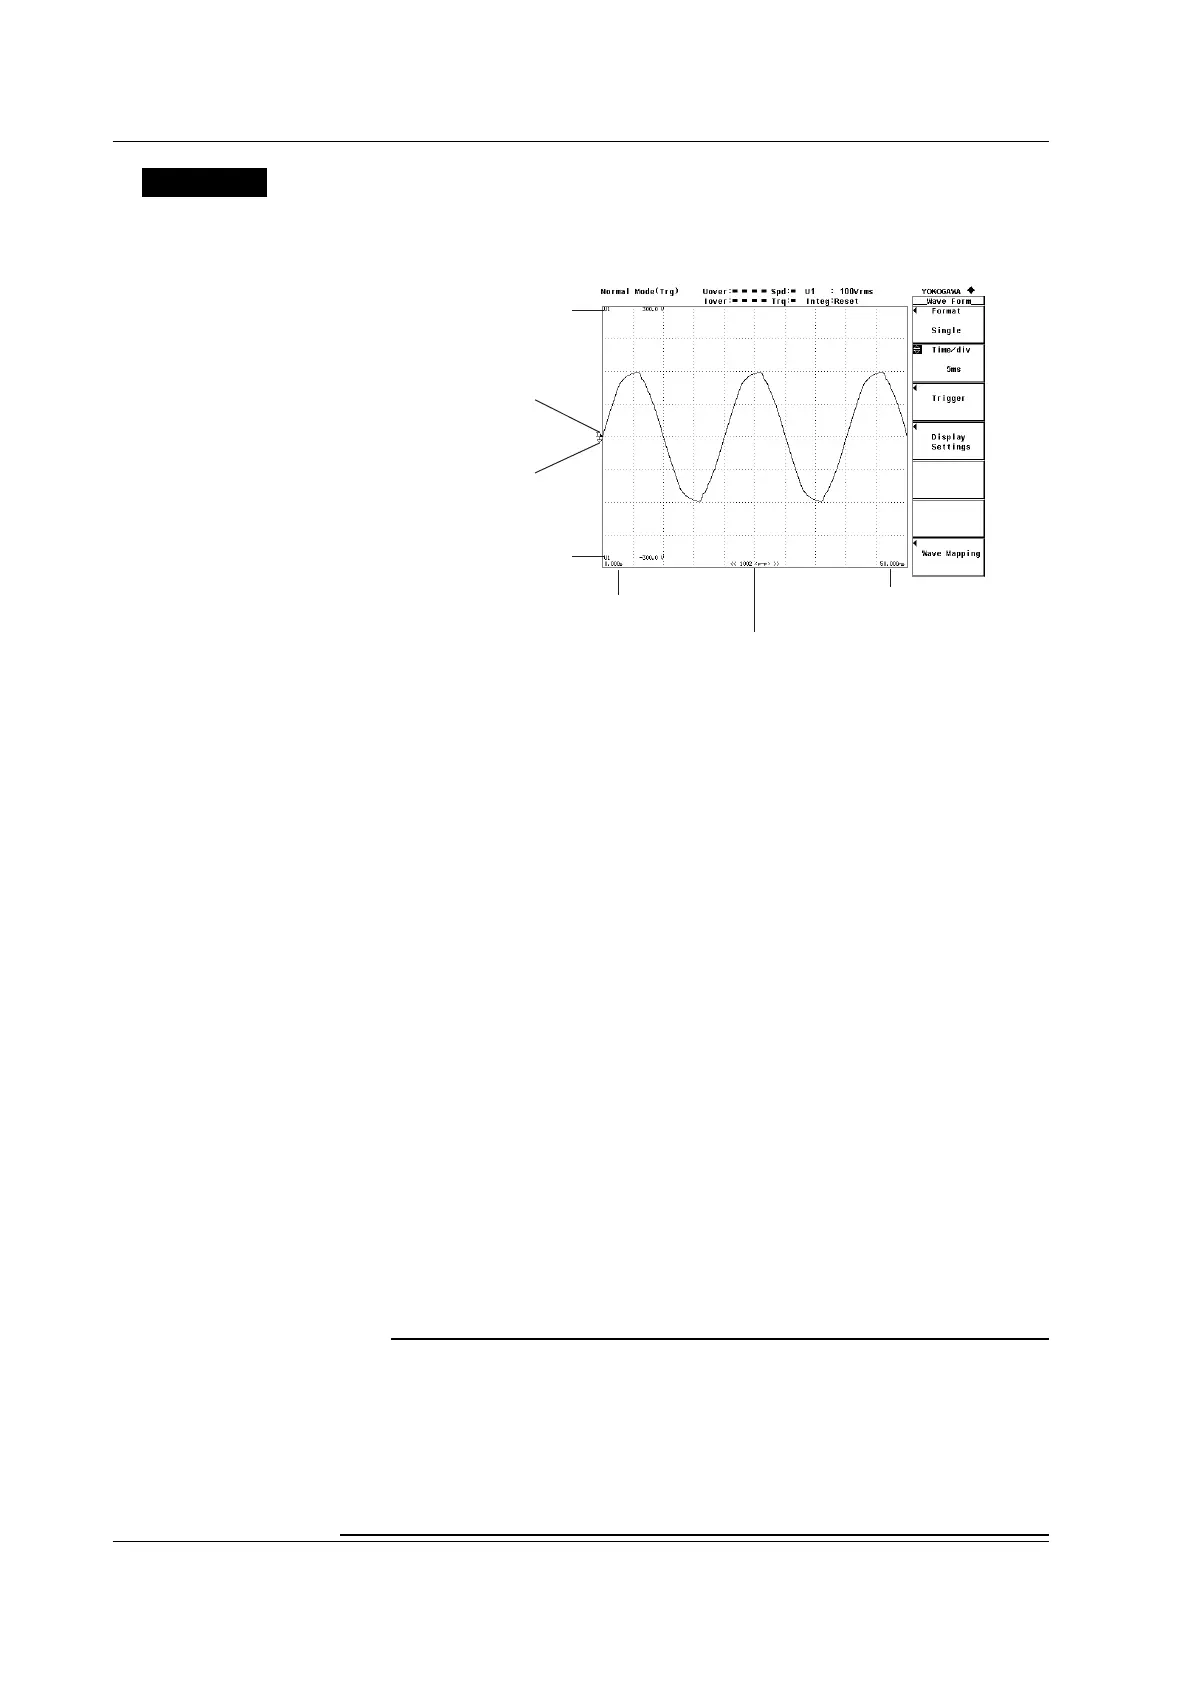
A display example is shown below. For the procedure to change the displayed items and
contents of waveforms, see sections 6.2 to 6.8.
Time at the right end of the screen
(time span of the screen)
Time at the left end of the screen
(fixed to 0 s)
• Number of data points displayed in the range
from the left to the right end of the screen
• When "P-P" is displayed, waveform is displayed
using P-P compression (see section 2.7)
Distinction of voltage or current,
the element, and the upper limit
of the displayed waveform
Distinction of voltage or current,
the element, and the lower limit
of the displayed waveform
Trigger level
Ground level
• Selecting the Display Mode
Select the waveform display format from the following:
• Displaying the Waveform on the Entire Screen
Press the WAVE key to display the waveform on the entire screen.
• Displaying the Waveform by Dividing the Display into Halves (Split Display)
• Numeric+Wave
The numeric data and waveform are displayed separately in the top and bottom
windows. For details on how to set the numeric data display, see section 3.15
and chapter 5.
•Wave+Bar
The waveform and bar graph are displayed separately in the top and bottom
windows. For details on how to set the bar graph display, see the
Expansion
Function User’s Manual IM760301-51E
.
• Wave+Trend
The waveform and trend are displayed separately in the top and bottom
windows. For details on how to set the trend, see chapter 7.
In addition, the measurement period of the numeric data and that of the waveform
data may not be synchronized.
Measurement Mode during Waveform Display
When waveforms are displayed, the measurement mode indication at the upper left
corner of the screen is set to Normal Mode (Trg). This mode in normal measurement
mode (normal mode) allows a measurement to be made after a trigger (see section
6.3) is detected for each update interval.
Note
• If the trigger is not set correctly, the start position (the signal level at the left end of the
screen) of the waveform display may be unstable, or waveforms may not be displayed.
• While integration is in progress or is suspended, the measurement mode indication at the upper
left corner of the screen is set to Normal Mode even when waveforms are displayed. In this mode,
the sampled data is automatically updated for each interval. In this case, the trigger function
for waveform display does not work. Therefore, the start position of the waveform display
(the signal level at the left end of the screen) may not be stable. In addition, the measurement
period of the numeric data and that of the waveform data may not be synchronized.
6.1 Waveform Display
 Loading...