HFA3 Instructions for Use 2660021166131 Rev. A 2018-11
Data, Tests & Reports Go to Contents
6-10
GPA Summary Report
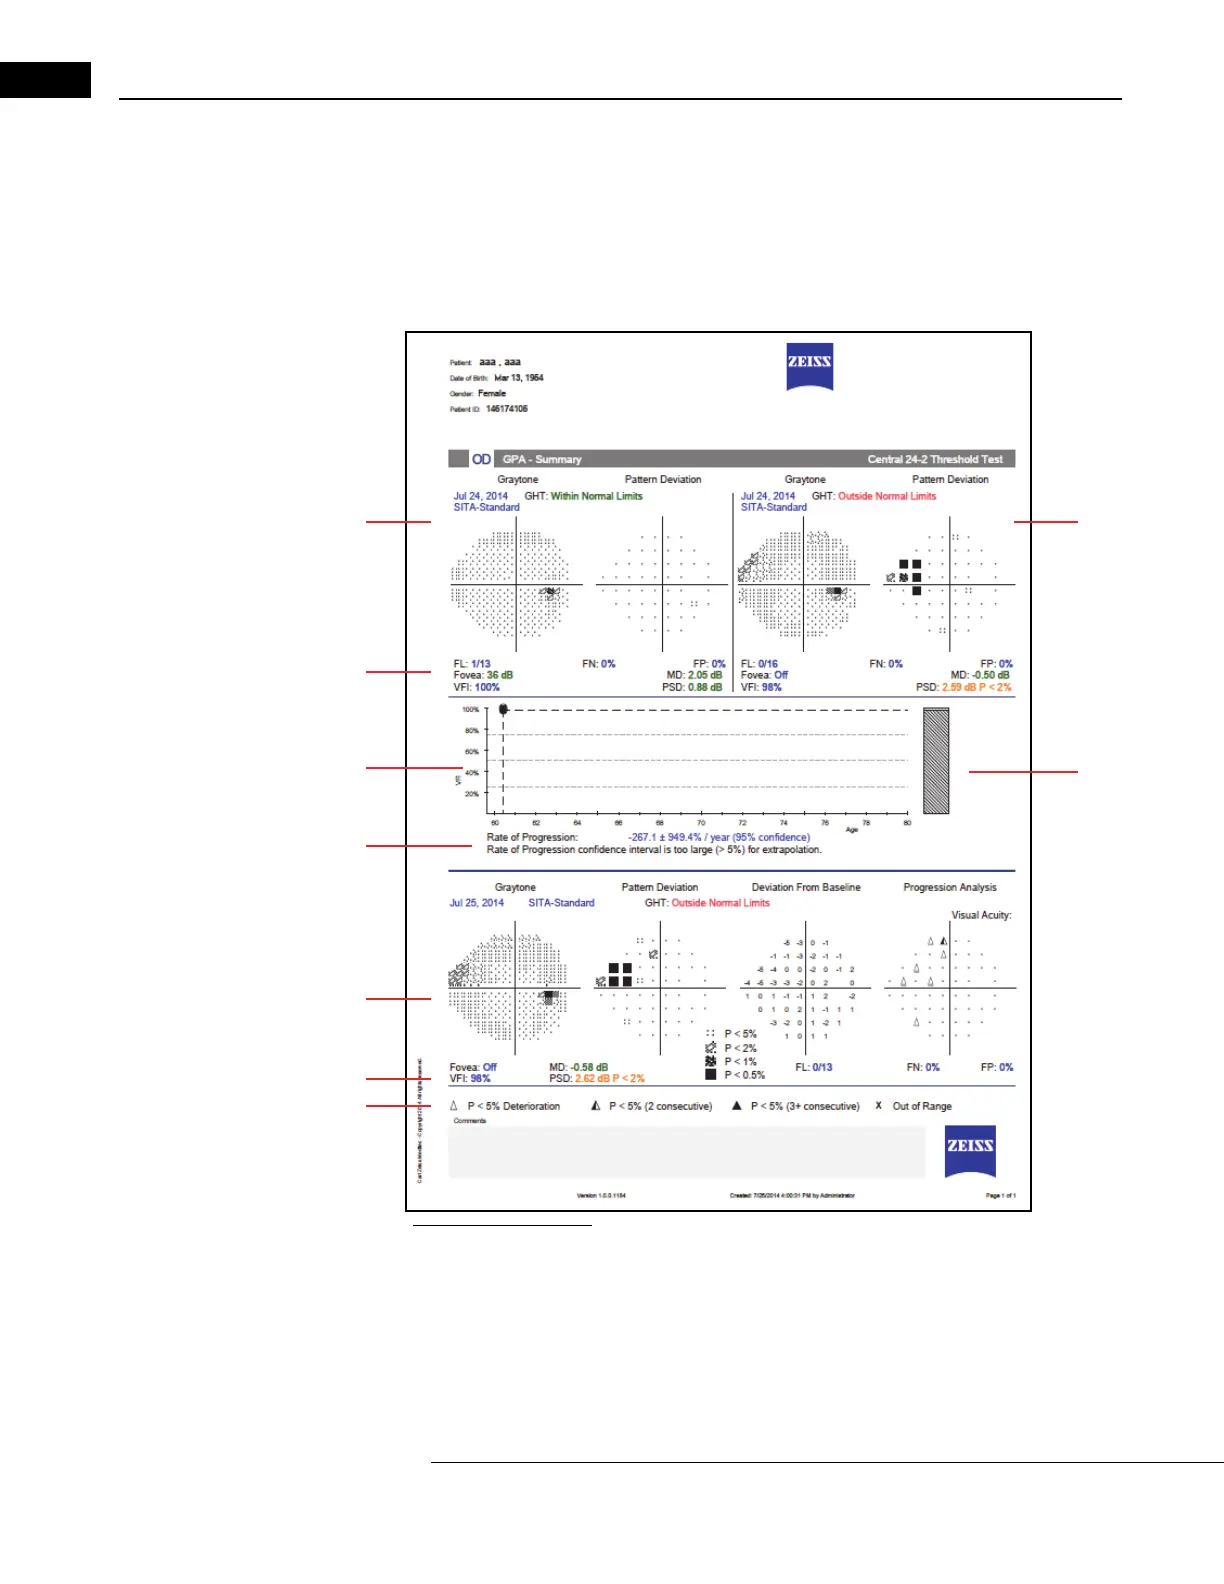
The GPA Summary report is a one-page report that pr
ovides an overview of the patient’s qualified
visual field history. At the top of the report, Grayscale and Pattern Deviation Plots are shown for
both GPA Baseline tests, along with key indices. The VFI Plot and VFI Bar are located in the center of
the page. Results for the current visual field test are shown at the bottom of the report, including
the Grayscale, Pattern Deviation, Deviation from Baseline, and the Progression Analysis Probability
Plots. The GPA Alert will appear here as well.
cáÖìêÉ=SKP=dm^=pìãã~êó
1 – Baseline 1 4 – VFI Plot 7 – Current Test
2 – Baseline 2 5 – VFI Bar 8 – VFI Value
3 – Indices 6 – VFI Linear Regression Analysis 9 – Progression Analysis Symbols
 Loading...