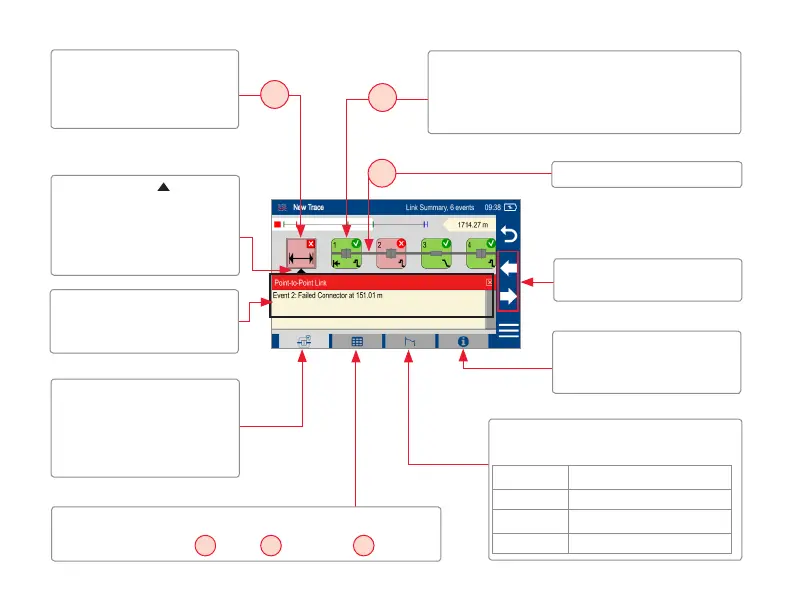
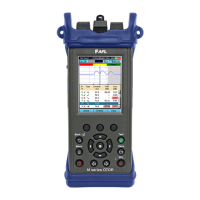
36
LinkMap tab: when in any
other test results viewer
(Event Table, Trace View, Test
Info View), touch to return to
LinkMap View
Event Table tab: touch to display measurements for the currently
selected Link Summary
A
, Event
B
, or Section
C
Trace tab - touch to display Trace view
that depends on active icon:
Icon Display View
Summary Trace of entire network
Event Trace zoomed in at event
Section N/A
Link Summary icon: may be
green (all events passed)
or red (one or more events
failed)
A
Info tab: touch to display
summary of OTDR settings
used for this test
Event icon: event icons may be green (pass) or red
(fail). Pass/Fail fault is based on event loss and
reectance thresholds congured by the currently
selected Pass/Fail Rule.
B
C
Fiber Section between events
Selection marker indicates
selected Summary, Event
or Fiber Section for which
additional details are
displayed.
Details of the currently
selected Summary, Event,
or Section
Touch to move to next or
previous event or ber section