7713395 R2 109
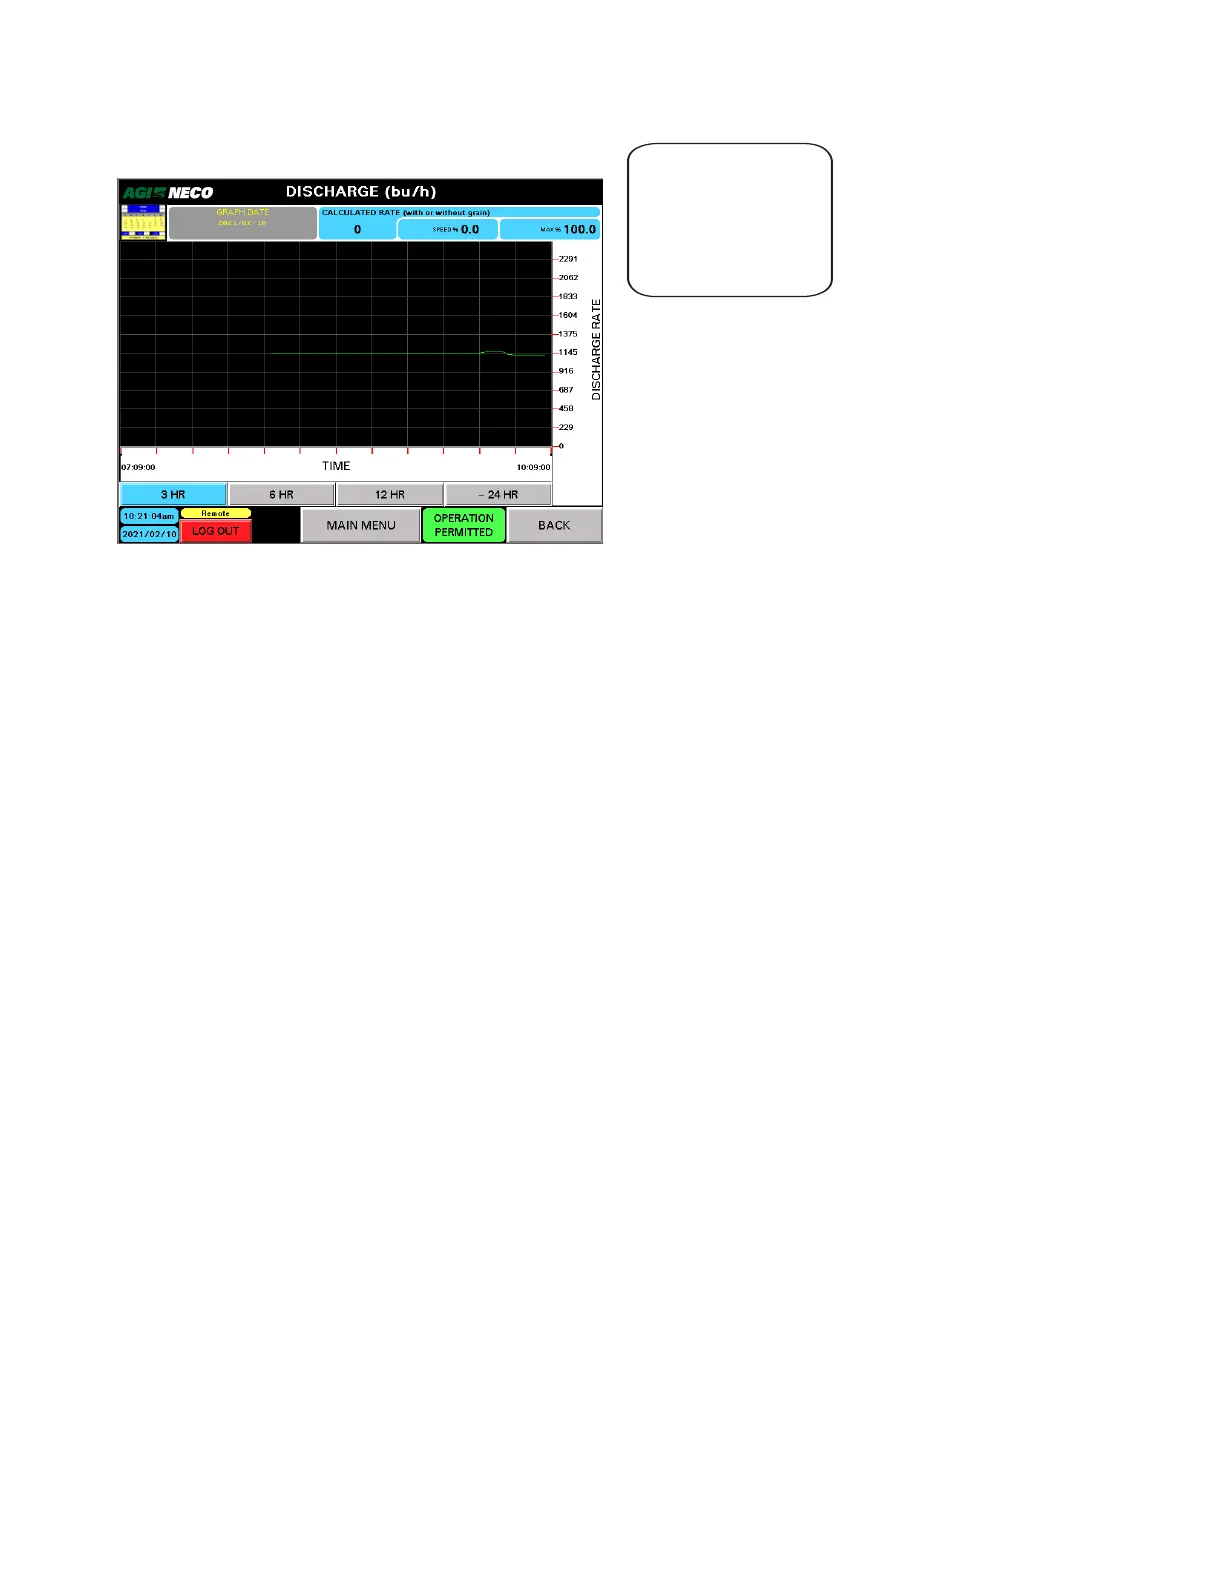
Figure 132. Discharge Rate
NOTE
All graphs capture a
data point every 3
minutes
• The graph is represented using the current mode of units, showing BPH (bushels per hour) or m
3
/ hr (cubic
meters per hour).
• The graph time period can be switched at any time and can be represented for 3, 6, 12, or 24 hour periods.
• Graphs also give current readings for applicable sensors. For instance, the moisture graph shows target
moisture, current actual inlet moisture, and current outlet moisture rates. The temperature graph shows
current inlet and outlet temperature. The discharge graph toggles, showing either current metering roll
speed (%) or volumetric throughput.
• Press the up or down arrow on the Grain Moisture Graph to increase or decrease the moisture range
displayed.
CONTINUOUS MIXED-FLOW GRAIN DRYER WITH COMMANDER CONTROL SYSTEM 4. OPERATION