GC Output Signals 7
Advanced Operation Manual 239
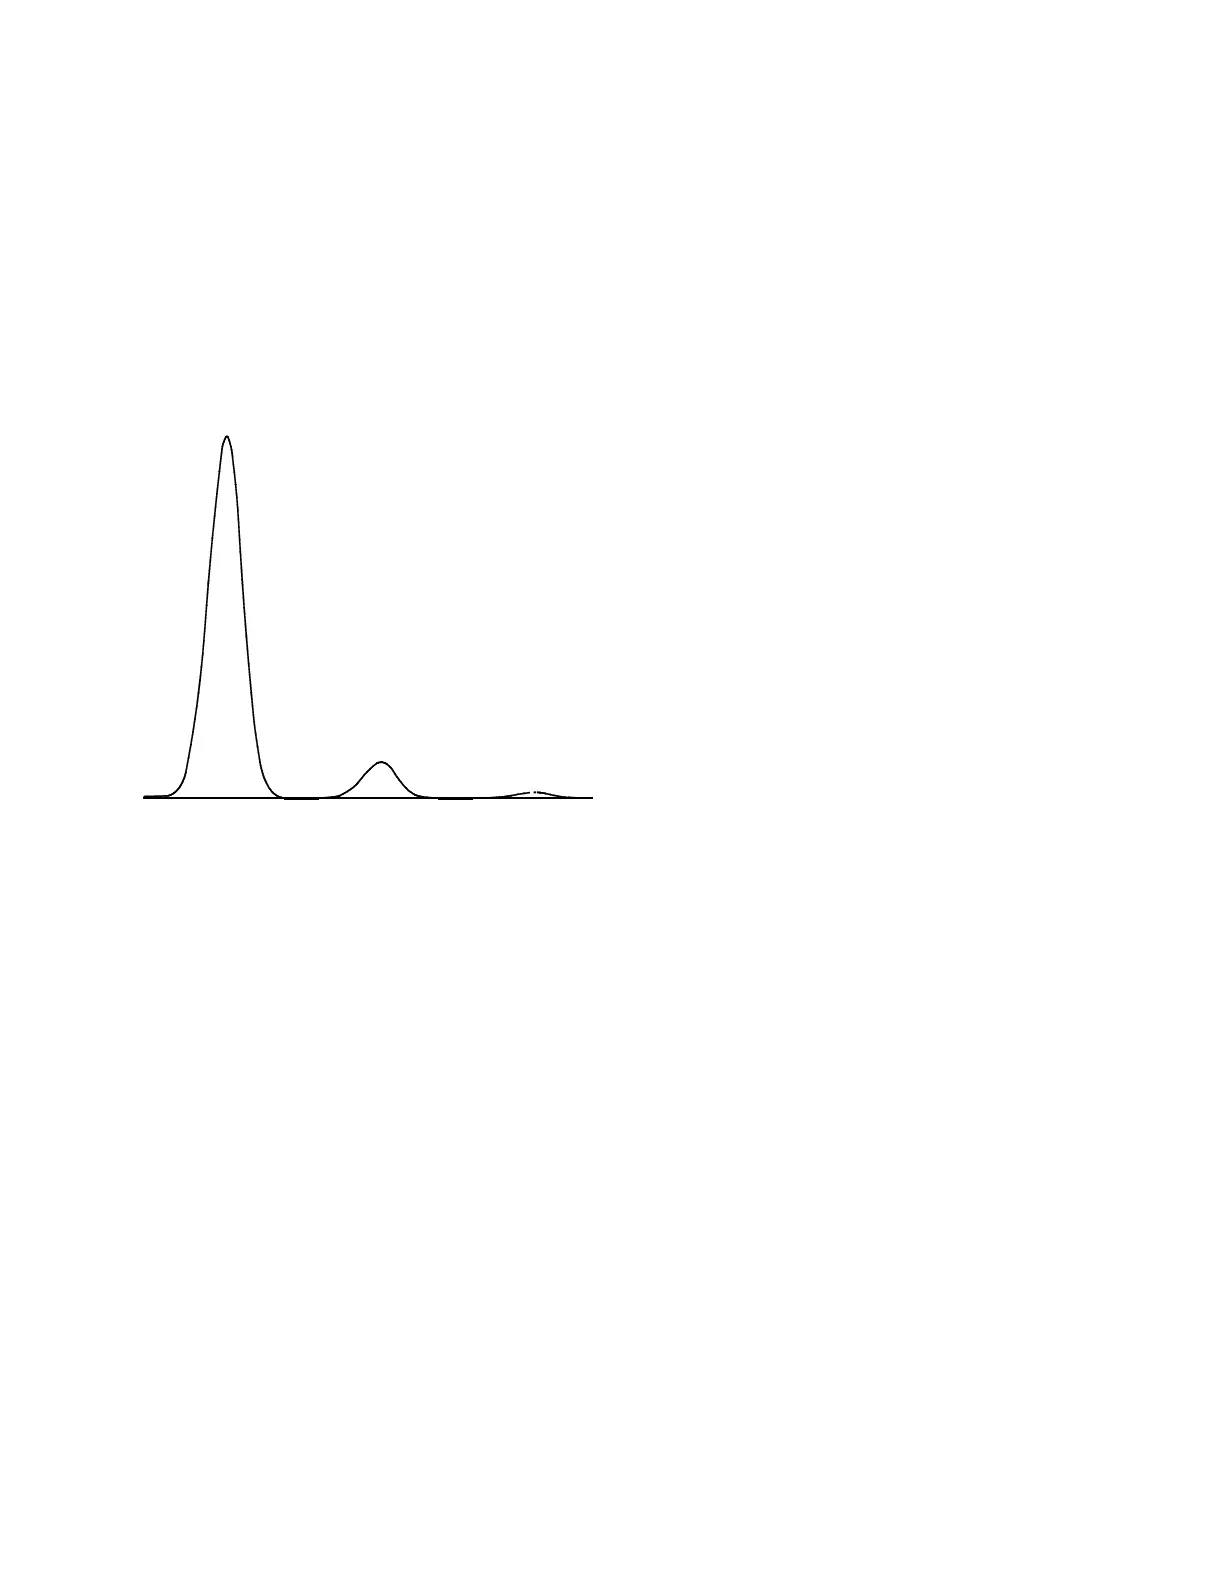
Test Plo t
Test plot is an internally generated “chromatogram” that can
be assigned to a signal output channel. It consists of three
baseline- resolved, repeating peaks. The area of the largest is
approximately 1 Volt- sec, the middle one is 0.1 times the
largest, and the smallest is 0.01 times the largest.
Test plot can be used to verify the operation of external data
processing devices without having to perform repeated
chromatographic runs. It may also be used as a stable signal
to compare the results from different data processing
devices.
To use the Test Plot:
1 Press [Analog Out 1] or [Analog Out 2].
2 Scroll to Ty pe : and press [Mode/Type].
3 Choose Test Plot.
4 Press [Start]. The plot will repeat until you press [Stop].
Test Plot is the default choice for the analog outputs.

 Loading...