Service Guide E8361-90001 3-27
PNA Series Microwave Network Analyzers Tests and Adjustments
E8361A System Verification
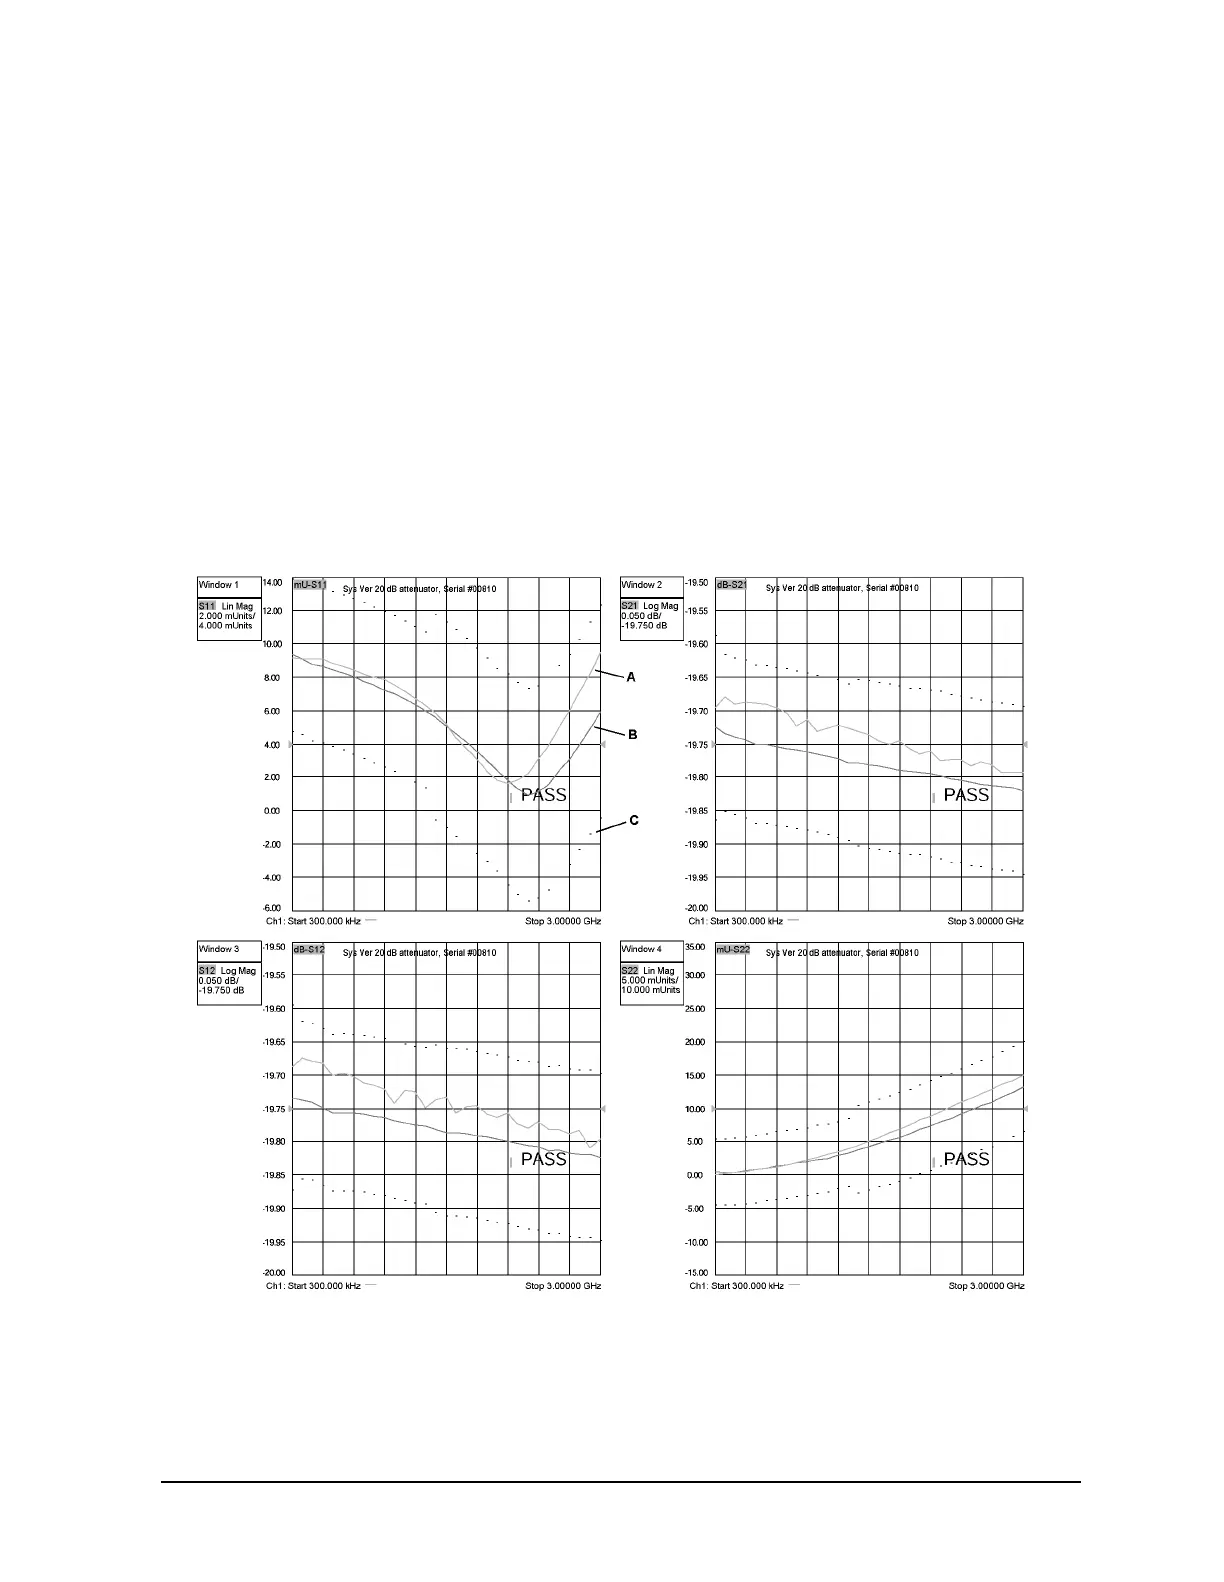
Figure 3-14 shows an example of typical verification results with Measurement Plots
selected in the Printer Output area of the System Verification windows. The printed
graphical results show the following:
• the name of the device measured
• the serial number of the device
• the parameters measured
• Results of the measurements. Labeled as A in Figure 3-14.
• Data measured at the factory from the verification kit. Labeled as B in Figure 3-14.
• Upper and lower limit points as defined by the total system uncertainty system.
Labeled as C in Figure 3-14.
Figure 3-14 Example of Printed Graphical Verification Results
 Loading...