For example, a baseline RTT of network path is 25 ms, and average RTT across
the entire transfer increases to 32 ms. Buffer Delay percentage would be
calculated as:
Buffer Delay (%) =
32 − 25
× 100 = 28
25
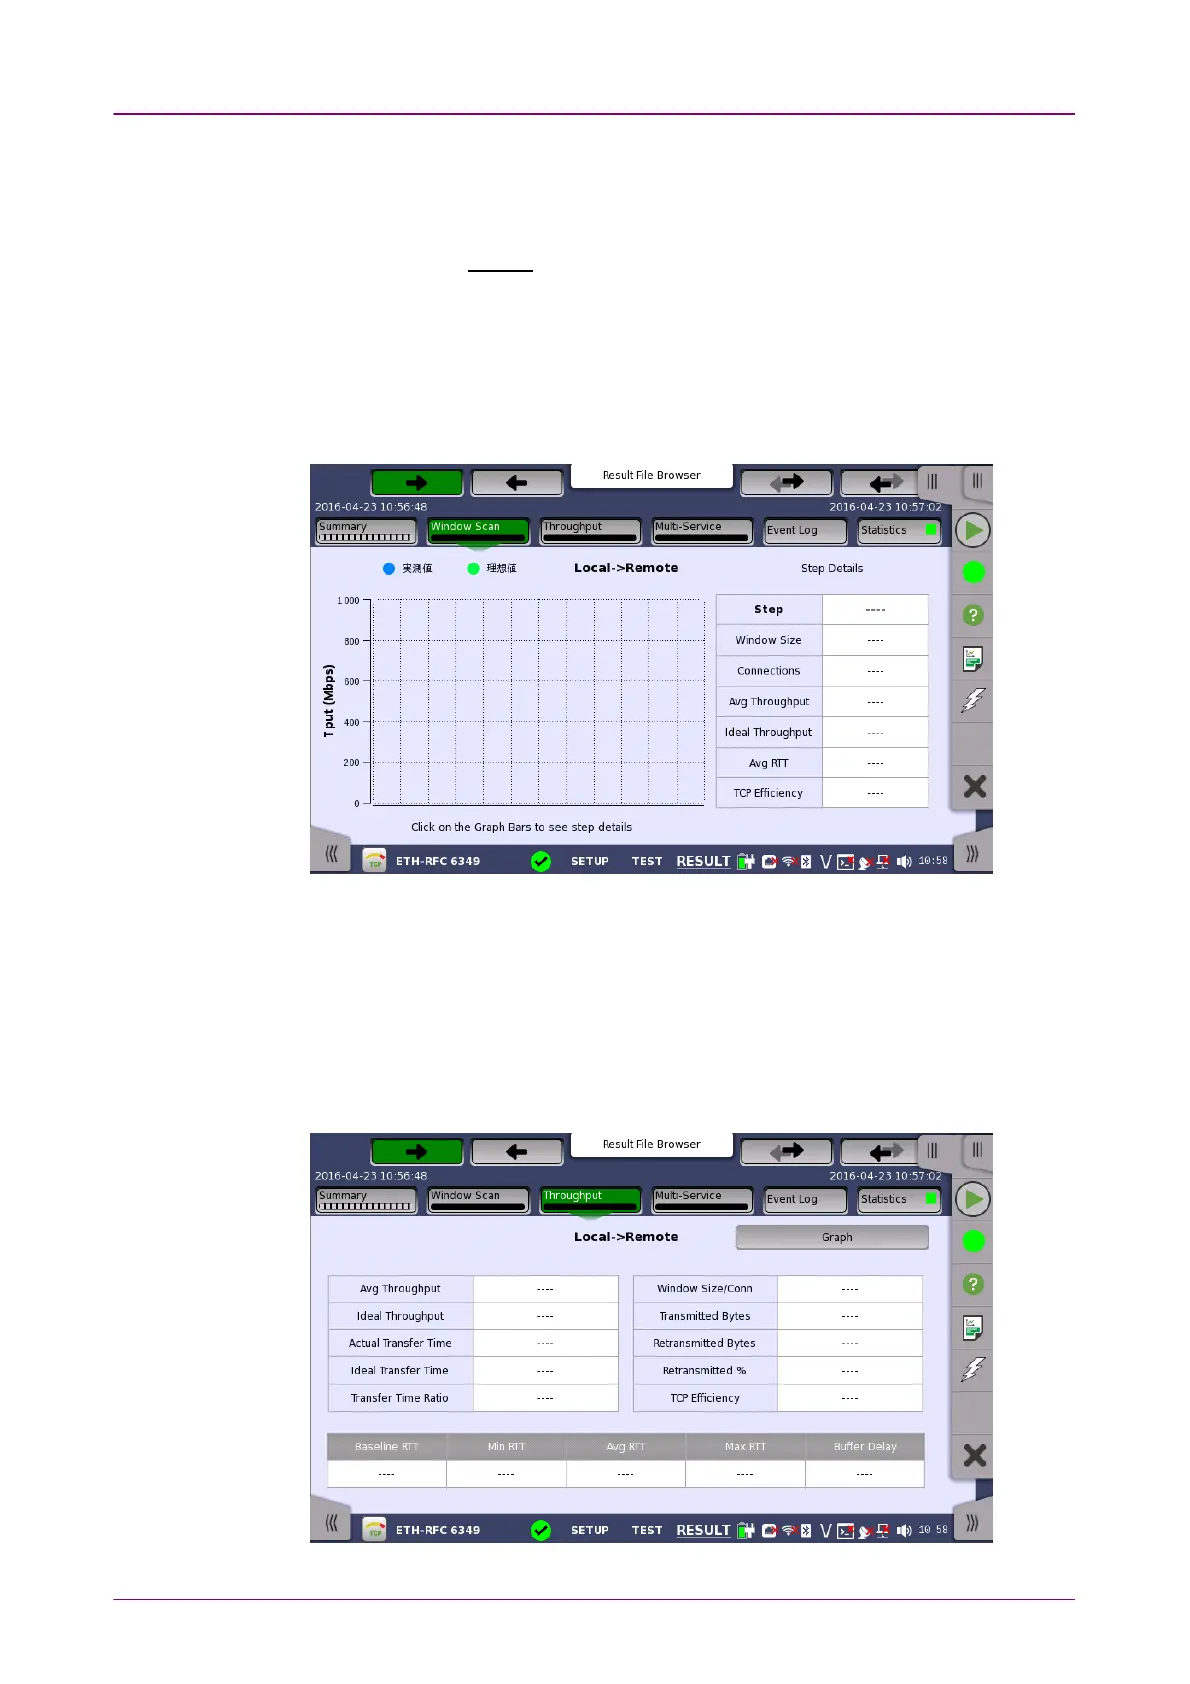
66..1010..33..33 Window ScanWindow Scan
Touching the Window ScanWindow Scan button in the navigation area will display the
screen shown below.
This screen presents the results from the Window Scan test. The ideal
throughput and the actual throughput are shown in the chart. If touching on the
Graph bars, step details appear in the right hand table.
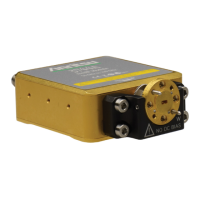
66..1010..33..44 ThroughputThroughput
Touching the ThroughputThroughput button in the navigation area will display the screen
shown below.