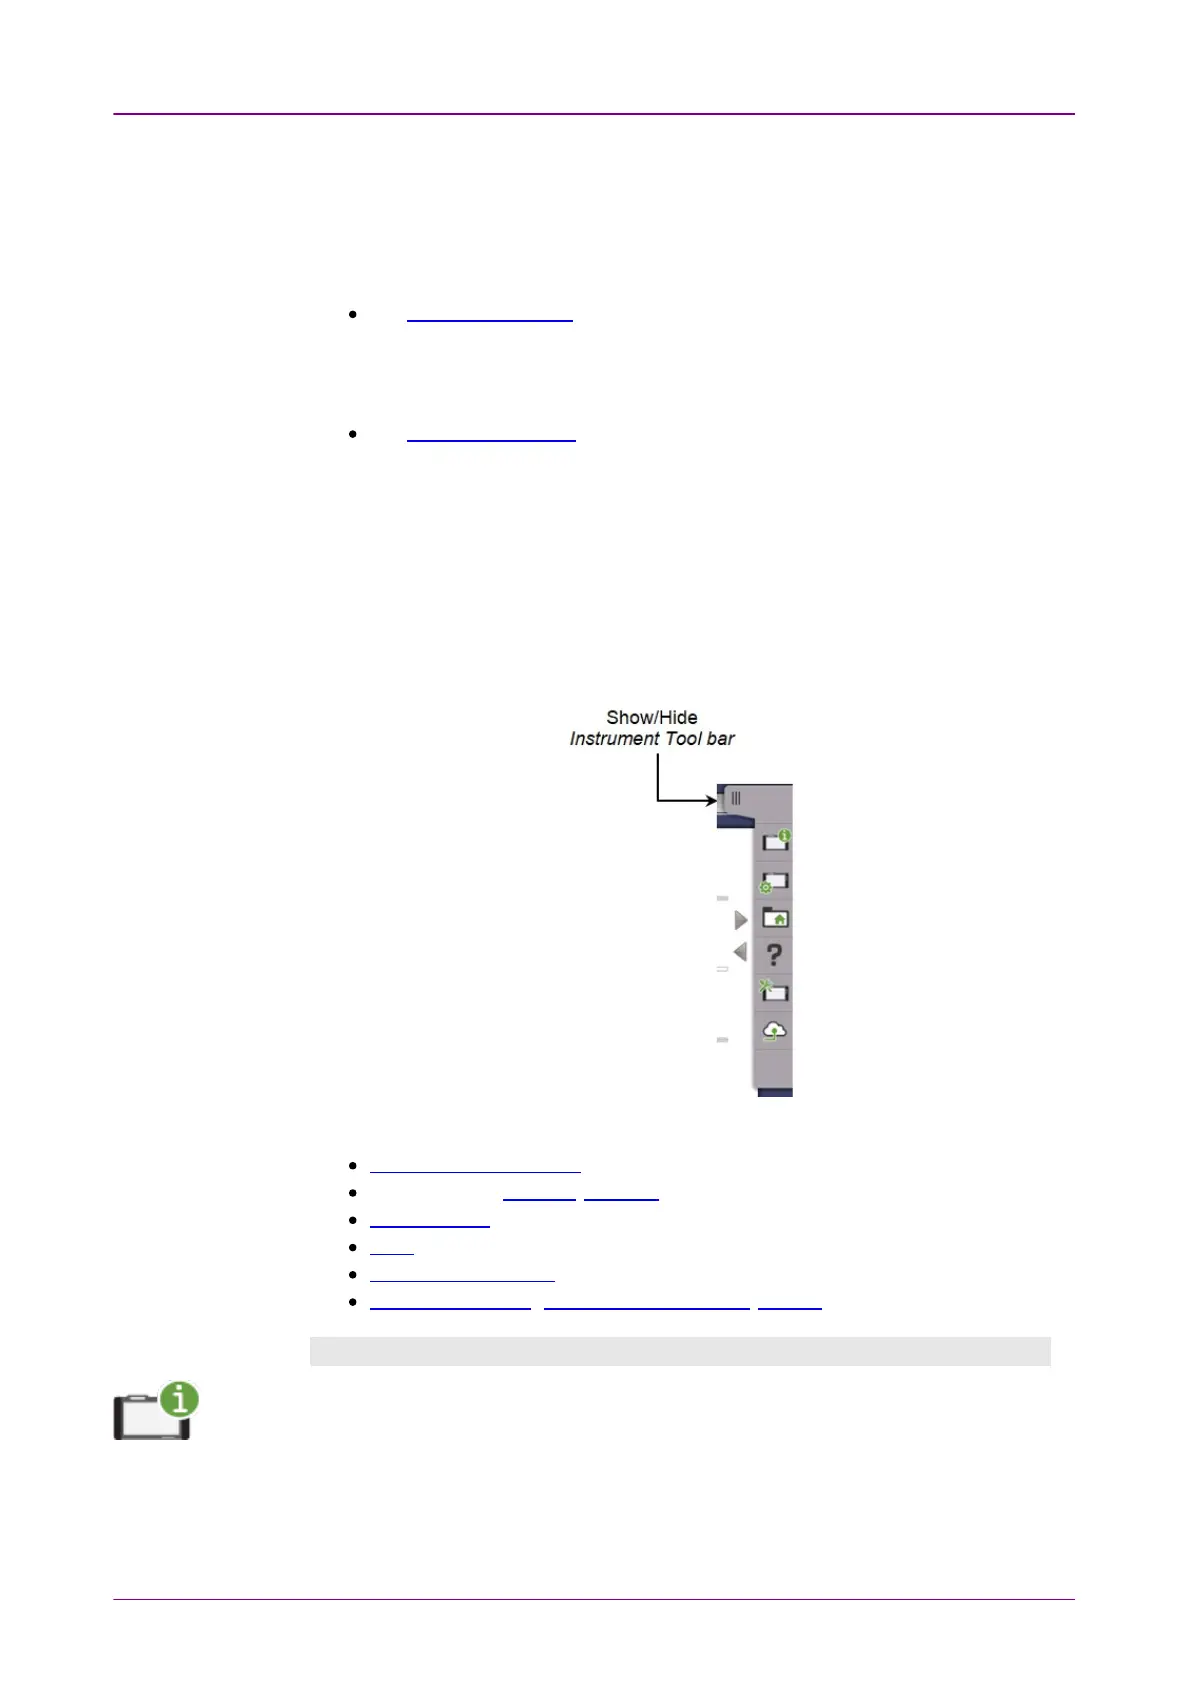
44..22 ToolbarsToolbars
Two toolbars are available on the right-hand side of the screen: the desktop
toolbar (called the
Instrument toolbar
) and the expandable workspace toolbar
(called the
Application toolbar
).
The
Instrument toolbar
contains general system functions and information
(e.g. Instrument configuration, Battery time etc.). It is available directly on the
screens related to the desktop, but can also be accessed on the workspace-
related screens as a "sub-toolbar" inside the application toolbar.
The
Application toolbar
contains application-related functions and
information (e.g. Start/Stop test, Error insertion etc.). It is available on the
screens related to a specific application (i.e. all workspace-related screens),
with the
Instrument toolbar
as a sub-toolbar.
44..22..11 Instrument ToolbarInstrument Toolbar
The
Instrument toolbar
is shown in the figure below. When the toolbar is
hidden, it is represented by its icon tab in the top right-hand corner of the
screen.
The
Instrument toolbar
contains the following functions/status:
Instrument Information
Configuration (General, Network)
File Manager
Help
Resource monitoring
Cloud Connection, (Upload Scenario Result, Details)
Instrument informationInstrument information
The
Information
icon launches the System InformationSystem Information screen. Touch the UpdateUpdate
About InfoAbout Info button to generate the instrument information.