98
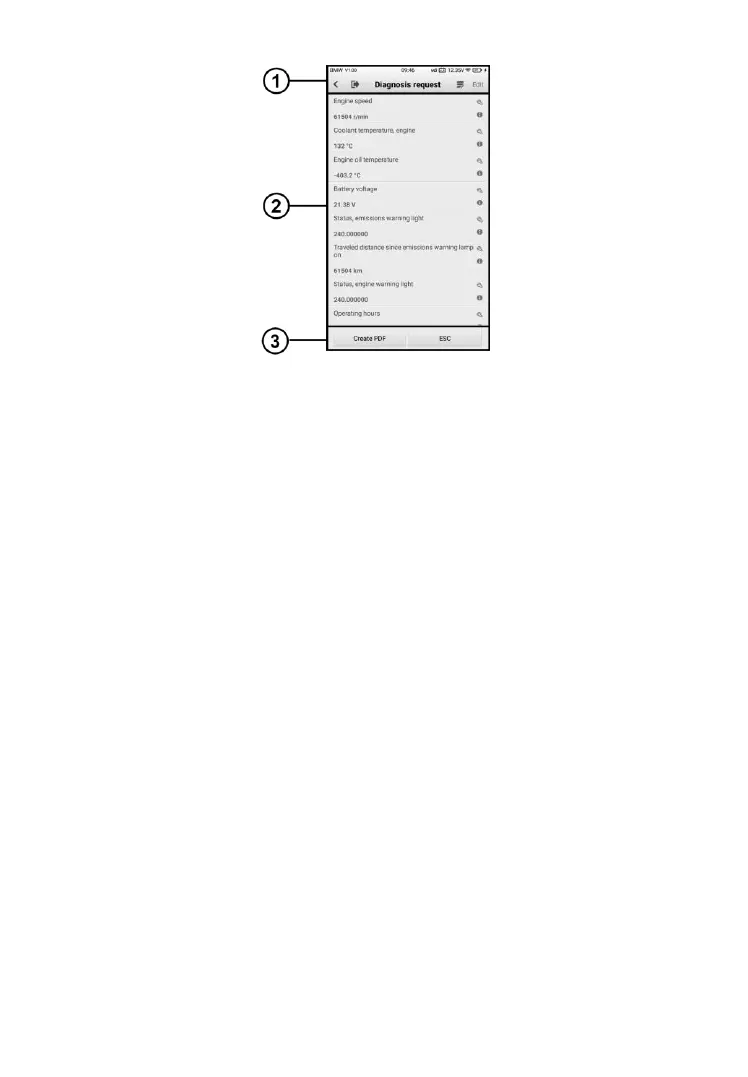
Figure 8-13 Sample Live Data Screen
① Diagnostics Toolbar Buttons – see Table 4-2 Top Toolbar Buttons on
Service Menu on page 27 for details.
② Main Section
⚫ Name Display area – displays the names and current values of the
parameter items.
a) Settings icon – tap the settings icon at the right side of the
parameter name to select a data display mode and set the value
range.
b) Information icon – tap the information icon at the right side of
the parameter name to view more information.
Display Mode
There are three types of display modes available for data viewing. Select
the proper mode for diagnostic purpose.
Tapping the settings icon on the right side of the parameter name to
access the details of data stream page. There are three buttons to
configure the data display mode, and a restore default settings button
to return to default settings.
Each parameter item displays the selected mode independently.