31
Example:
rate control for 4 energy rates and 2 maximum demand rates:
Switching times Rates
from to Energy (AT) Demand (MT)
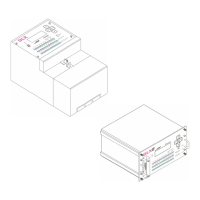
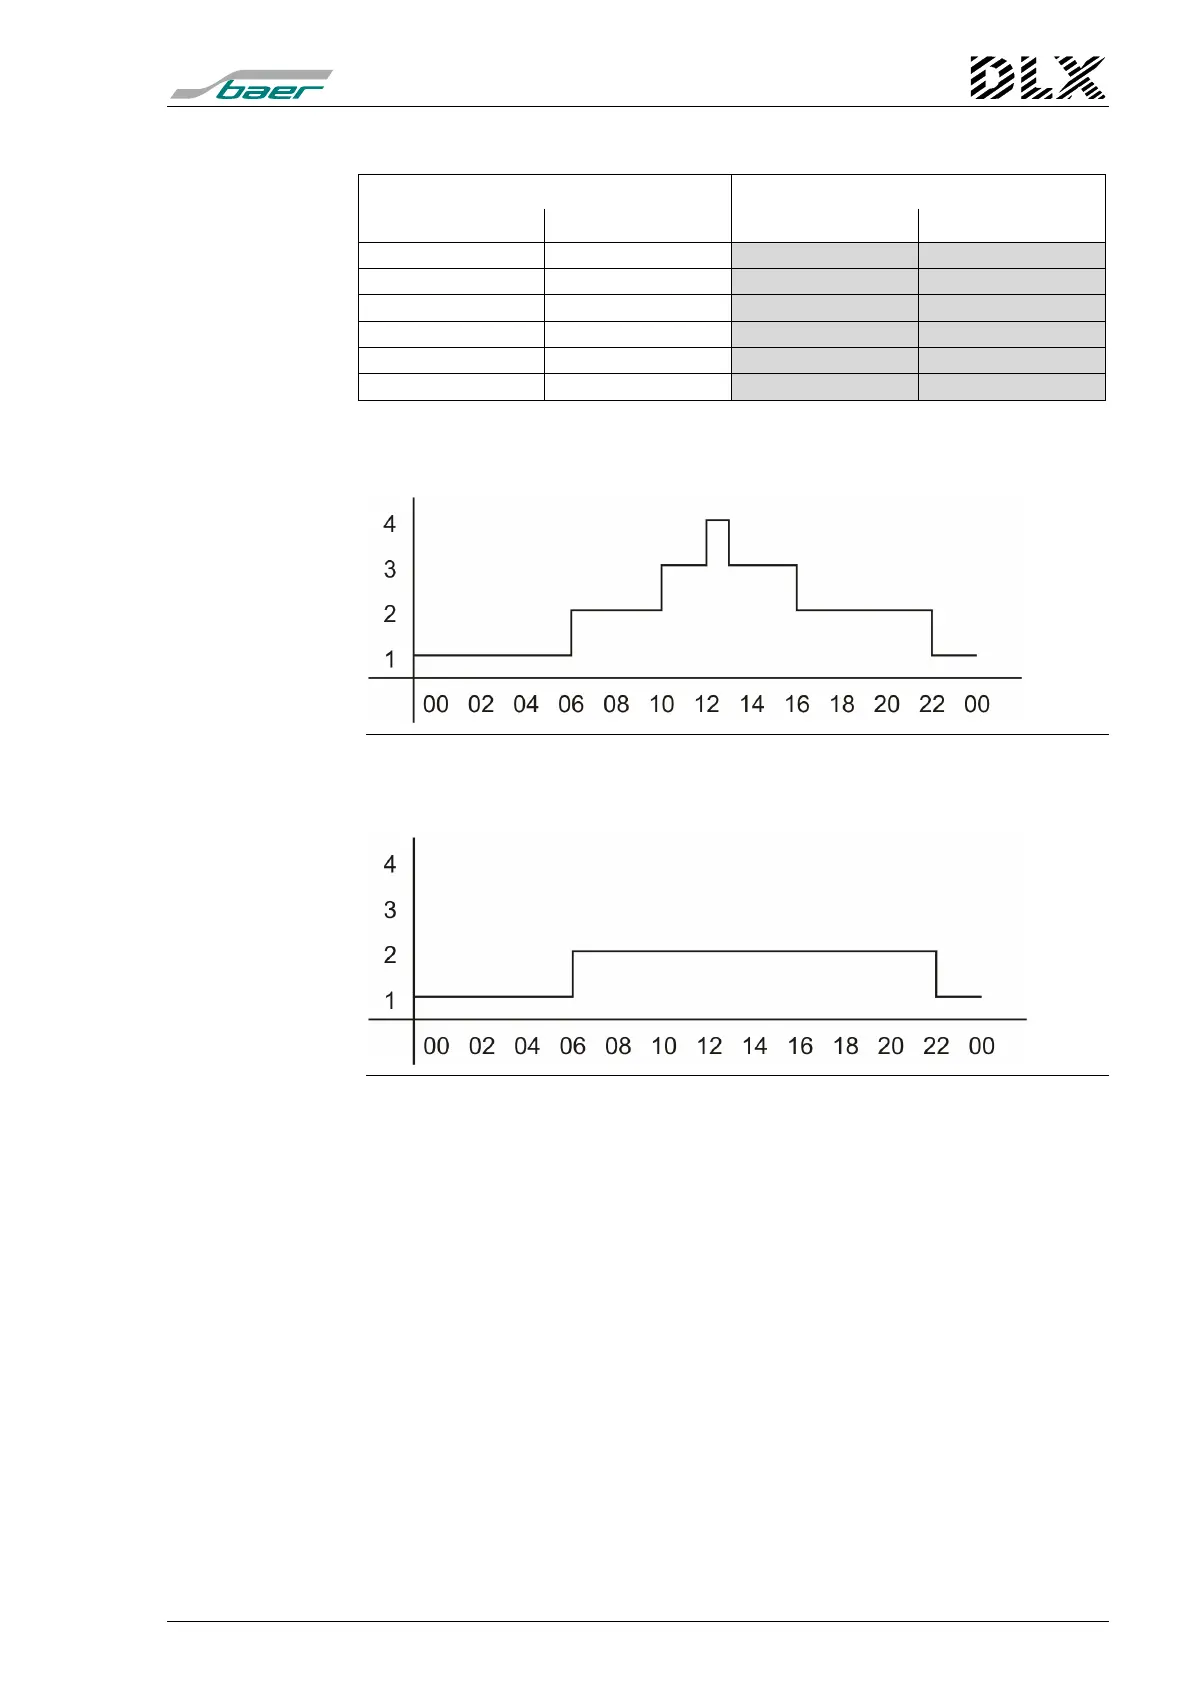
06:00 10:00 AT2 MT2
10:00 12:00 AT3 MT2
12:00 13:00 AT4 MT2
13:00 16:00 AT3 MT2
16:00 22:00 AT2 MT2
22:00 06:00 AT1 MT1
This rate table relates to the following energy and demand rate curves:
Energy rate (AT):
Figure 7, Energy rate (AT):
Demand rate (MT):
Figure 8, Demand rate (MT):
The daily rate tables determine the rate curves that are used for different
days within a year. These tables are linked to seasons by means of the
weekly programs.