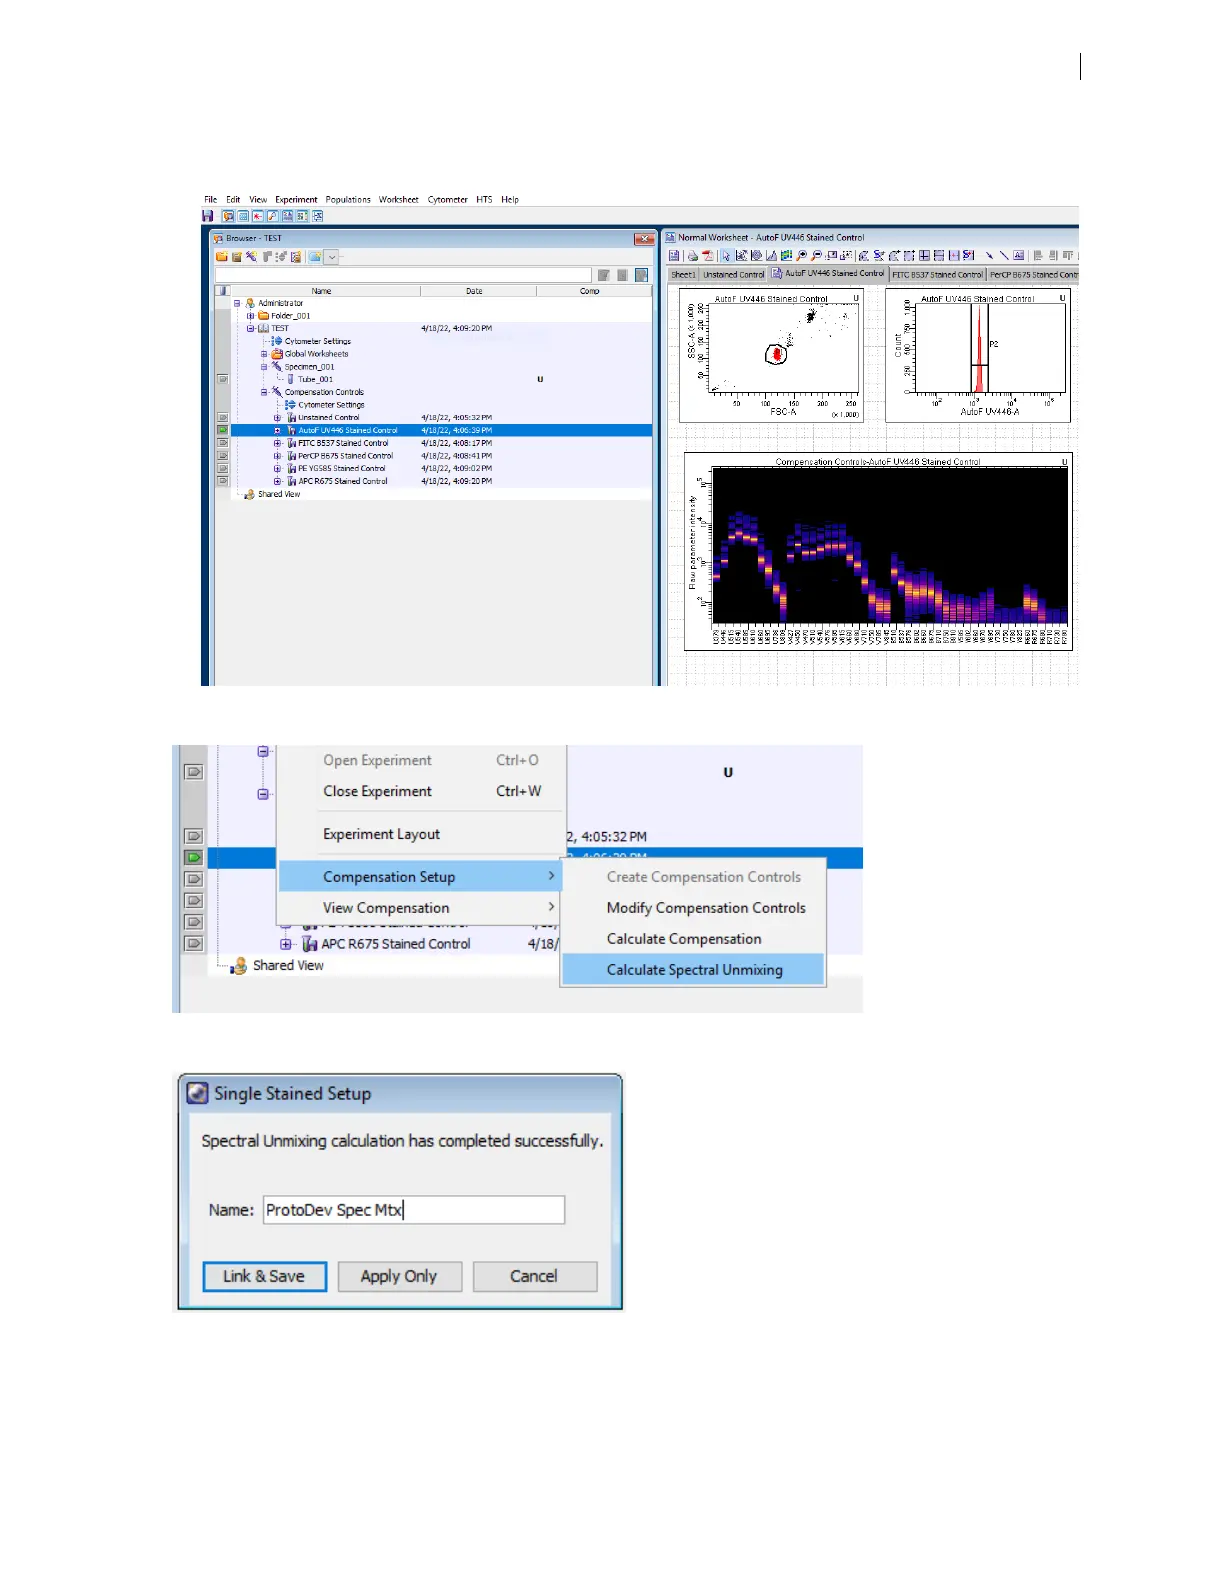
h. If necessary, adjust the position and width of the P2 gate to span the positive population on the
histogram plot.
6. Select Experiment > Compensation Setup > Calculate Spectral Unmixing.
The screen displays the Single Stained Setup dialog.
7. Enter a name for the setup and click Link & Save to link the compensation setup to the cytometer settings
and to save the settings to the Compensation Settings catalog.
Chapter 5 Spectral functions 61